


Spectral characteristics and correlation of heavy metal and vegetation cover stress in Fanshan copper-molybdenum
-
摘要: 高光谱遥感在地物精细探测方面具有较高的精度,能够实现弱缓信息的提取。应用高光谱遥感技术研究福建矾山高植被覆盖铜钼矿区重金属铜铅等元素与覆盖植被光谱胁迫相关性。通过对比分析矿区与非矿区典型植被光谱特征,在光谱特征分析结果基础上得出矿区典型植被均不同程度受到了重金属元素胁迫,并造成光谱曲线发生变异。在分析结果基础上,结合植被地球化学数据建立重金属与植被光谱胁迫相关性数学模型,提出矿区重金属与覆盖植被胁迫相关性。依据该模型可获得金属元素的空间分布,最终实现高光谱遥感技术在高植被覆盖区地质找矿中的应用。Abstract: Hyperspectral technology has high precision in the fine detection of ground objects, and can realize the extraction of weak information. In this paper, hyperspectral remote sensing technology was used to study the correlation between heavy metals, copper and lead, and the spectral stress of covered vegetation in the high-vegetation area of Fanshan, Fujian. By comparing and analyzing the spectral characteristics of typical vegetation in mining areas and non-mineral areas, this paper indicates that the typical vegetation in the mining area is subjected to heavy metal element stress to different degrees, causing the spectrum to mutate. Based on the analysis results, the paper established the mathematical model of correlation between heavy metal and vegetation spectral stress based on vegetation geochemical data, and proposes the correlation between heavy metal and vegetation cover stress. According to the model, the spatial distribution of metal elements can be obtained, and finally the application of high-spectral remote sensing in geological prospecting in high vegetation coverage areas is overcome.
-

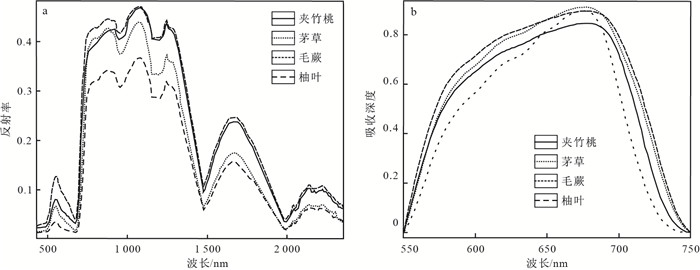
图 1 矿区典型植被野外光谱反射图(a)和光谱吸收深度图(b)
Figure 1. Field spectral reflectance (a) and spectral absorption depth map of typical vegetation
表 1 矾山矿区与非矿区典型植被金属元素平均质量分数
Table 1. Average content of metal elements in typical vegetation of Fanshan mining area and non-mining area
植被类型 区域 Cu Pb Zn Mo Co Bi wB/10-6 柚叶 非矿区 62.097 50 1.081 307 21.799 33 0.122 614 0.117 673 0.031 793 矿区 76.852 86 1.479 766 23.519 86 0.142 834 0.136 509 0.040 556 茅草 非矿区 7.262 083 1.148 877 35.267 42 0.135 238 0.261 183 0.011 163 矿区 7.389 583 2.952 652 35.542 08 0.283 603 0.291 253 0.017 007 毛蕨 非矿区 7.100 714 9.680 229 37.028 00 0.068 664 0.133 623 0.011 722 矿区 7.541 111 48.993 470 38.387 44 0.224 708 0.137 149 0.014 408 夹竹桃 非矿区 14.111 25 61.180 25 24.779 5 0.107 069 0.606 210 0.015 072 矿区 15.454 00 138.105 30 24.918 0 0.276 837 0.714 096 0.018 957  下载: 导出CSV
表 2 非矿区与矿区柚叶光谱叶绿素及水吸收特征指数对比
Table 2. Comparison of chlorophyll and water absorption characteristics of grapefruit leaves in non-mineral and mining areas
柚叶 叶绿素吸收(680 nm) 水吸收(970 nm) 水吸收(1 170 nm) 中心波长/nm 吸收深度 中心波长/nm 吸收深度 中心波长/nm 吸收深度 非矿区点1 677 0.936 2 974 0.182 1 1 162 0.146 0 非矿区点1-1 677 0.886 3 975 0.176 5 1 162 0.132 6 非矿区点1-2 677 0.901 8 973 0.167 3 1 161 0.114 3 非矿区点1-6 676 0.935 9 974 0.127 6 1 162 0.125 3 矿区A点 677 0.916 3 972 0.125 4 1 165 0.154 7 矿区D点 675 0.891 3 954 0.067 6 1 166 0.110 4 矿区1-6点 674 0.901 2 973 0.093 9 1 166 0.151 0 矿区2-4点 677 0.906 3 974 0.097 9 1 169 0.131 7 矿区2-5点 674 0.911 6 964 0.057 6 1 168 0.125 6 矿区2-6点 675 0.916 5 954 0.139 4 1 156 0.194 4 矿区2-9点 676 0.874 5 965 0.064 8 1 158 0.127 9 矿区3-7点 676 0.921 7 956 0.096 0 1 158 0.166 6 矿区4-4点 676 0.906 3 956 0.076 4 1 157 0.103 4 矿区垂-1点 676 0.878 4 958 0.100 1 1 158 0.115 8 矿区垂-2点 674 0.932 0 1001 0.071 1 1 161 0.139 0 矿区垂-3点 676 0.934 4 956 0.116 4 1 156 0.160 0 矿区矿洞口 675 0.924 1 963 0.104 4 1 159 0.171 1
下载: 导出CSV
表 3 非矿区与矿区毛蕨叶绿素及水吸收特征指数对比
Table 3. Comparison of chlorophyll and water absorption characteristics of non-mineral area and mining area
毛蕨 叶绿素吸收(680 nm) 水吸收(970 nm) 水吸收(1 170 nm) 中心波长/nm 吸收深度 中心波长/nm 吸收深度 中心波长/nm 吸收深度 非矿区点1 676 0.923 2 964 0.101 2 1 163 0.122 8 非矿区点1-1 675 0.924 2 965 0.100 3 1 162 0.122 1 非矿区点1-2 676 0.886 4 964 0.102 3 1 163 0.114 3 非矿区点1-5 675 0.875 2 964 0.101 0 1 163 0.127 6 矿区A点 677 0.927 4 974 0.096 4 1 172 0.114 3 矿区1-6点 677 0.907 7 975 0.055 9 1 166 0.103 0 矿区2-5点 678 0.909 9 954 0.093 2 1 157 0.127 3 矿区2-6点 678 0.897 4 955 0.082 5 1 152 0.108 4 矿区2-9点 677 0.898 7 955 0.064 9 1 153 0.113 2 矿区3-7点 678 0.906 7 963 0.063 9 1 156 0.112 0 矿区4-5点 673 0.904 4 959 0.079 4 1 165 0.104 1 矿区垂-1点 672 0.912 5 959 0.064 8 1 158 0.106 2 矿区垂-2点 673 0.906 8 957 0.055 8 1 157 0.106 8 矿区垂-3点 674 0.904 5 972 0.075 9 1 160 0.101 6 矿区矿洞口 676 0.907 9 954 0.097 2 1 155 0.136 2
下载: 导出CSV
表 4 非矿区与矿区夹竹桃内叶绿素及水吸收特征指数对比
Table 4. Comparison of chlorophyll and water absorption characteristics of oleander in non-mineral area and mining area
夹竹桃 叶绿素吸收(680 nm) 水吸收(970 nm) 水吸收(1 170 nm) 中心波长/nm 吸收深度 中心波长/nm 吸收深度 中心波长/nm 吸收深度 非矿区点1 672 0.936 2 954 0.094 2 1 153 0.118 1 非矿区点1-1 672 0.923 1 954 0.092 1 1 151 0.116 3 非矿区点1-4 673 0.912 3 953 0.094 5 1 153 0.114 2 非矿区点1-5 672 0.931 2 954 0.100 1 1 153 0.134 1 矿区A点 675 0.876 9 1 002 0.123 5 1 158 0.172 6 矿区2-7点 678 0.903 4 951 0.055 2 1 157 0.103 4 矿区2-9点 675 0.845 4 973 0.076 3 1 159 0.084 3 矿区垂-1点 673 0.927 2 957 0.072 7 1 157 0.128 3 矿区垂-2点 676 0.883 5 967 0.058 5 1 162 0.106 5 矿区垂-3点 674 0.912 1 959 0.094 5 1 159 0.163 4 矿区矿洞口 676 0.875 7 957 0.074 2 1 157 0.113 1
下载: 导出CSV
表 5 非矿区与矿区茅草内叶绿素及水吸收特征指数
Table 5. Chlorophyll and water absorption characteristics index of thatch in non-mineral area and mining area
茅草 叶绿素吸收(680 nm) 水吸收(970 nm) 水吸收(1 170 nm) 中心波长/nm 吸收深度 中心波长/nm 吸收深度 中心波长/nm 吸收深度 非矿区点1 676 0.922 4 953 0.099 2 1 152 0.164 5 非矿区点1-1 675 0.923 1 953 0.092 3 1 151 0.168 7 非矿区点1-2 676 0.913 4 952 0.095 4 1 152 0.160 1 非矿区点1-5 676 0.906 7 954 0.090 1 1 152 0.159 8 矿区A点 679 0.865 3 958 0.085 4 1 164 0.130 3 矿区1-6点 679 0.876 4 974 0.063 9 1 168 0.116 7 矿区2-4点 679 0.907 2 956 0.124 5 1 157 0.175 6 矿区2-5点 677 0.797 3 957 0.093 5 1 157 0.137 4 矿区4-5点 673 0.918 9 962 0.088 9 1 157 0.142 7 矿区垂-1点 679 0.866 1 950 0.089 3 1 153 0.133 4 矿区垂-2点 677 0.857 3 957 0.082 9 1 158 0.156 7 矿区垂-3点 678 0.883 4 956 0.094 5 1 151 0.150 9 矿区矿洞口 676 0.925 3 958 0.115 3 1 159 0.185 5
下载: 导出CSV
表 6 植物叶片中金属元素质量分数
Table 6. Metal element content in plant leaves
wB/10-6 样品 Cu Pb Zn Mo Co Bi 非矿区 BS-1-1夹竹桃 14.04 64.248 22.752 0.053 6 1.221 6 0.010 008 BS-1-3夹竹桃 19.655 25.446 31.733 0.125 67 0.147 76 0.016 126 BS-1-5夹竹桃 12.295 59.746 21.696 0.119 675 0.789 58 0.006 405 BS-1-2毛蕨叶 5.19 16.748 36.185 0.066 3 0.105 72 0.011 76 BS-1-3毛蕨叶 6.54 4.300 2 33.192 0.110 385 0.044 58 0.010 656 BS-1-5毛蕨叶 7.05 21.576 35.985 0.071 09 0.176 94 0.007 018 BS-1-2柚叶 34.105 0.977 14 16.461 0.089 145 0.080 34 0.035 126 BS-1-3柚叶 78.67 1.184 36 20.829 0.132 285 0.119 56 0.036 334 BS-1-4柚叶 145.66 1.681 2 23.889 0.165 395 0.168 44 0.049 978 BS-1-2茅草叶 6.99 0.553 15.093 0.096 97 0.213 26 0.006 709 BS-1-3茅草叶 6.565 2.032 2 15.049 0.128 475 0.207 44 0.016 868 BS-1-5茅草叶 8.495 0.897 68 20.817 0.128 63 0.445 56 0.015 219 矿区 垂-1柚叶 79.705 2.229 2 17.723 0.100 3 0.417 78 0.059 73 垂-2柚叶 95.635 1.421 0 15.966 0.163 5 0.068 34 0.045 149 垂-3柚叶 57.24 1.756 8 15.048 0.180 135 0.129 36 0.045 72 3-7柚叶 25.56 1.214 4 23.4 0.173 43 0.056 34 0.034 56 2-5柚叶 242.47 1.673 4 20.595 0.128 07 0.091 48 0.044 841 2-9柚叶 4.38 1.093 62 20.794 0.088 38 0.115 22 0.025 806 2-4柚叶 82.2 3.555 19 0.26 0.502 5 0.109 75 D点-柚叶 21.5 0.847 5 20.575 0.075 0.017 5 0.034 25 垂-1毛蕨叶 6.34 65.081 0 29.123 0.131 82 0.251 64 0.009 973 3-7毛蕨叶 6.305 22.894 47.83 0.403 725 0.066 7 0.022 319 2-7毛蕨叶 9.67 178.98 37.126 0.141 525 0.255 48 0.016 419 2-6毛蕨叶 4.685 5.893 26.845 0.132 12 0.145 28 0.015 72 2-9毛蕨叶 3.405 5.652 6 27.226 0.095 845 0.224 34 0.008 854 1-6毛蕨叶 6.985 1.200 6 37.198 0.080 67 0.066 22 0.010 246 垂-2毛蕨叶 5.025 39.88 48.6 0.175 0.02 0.037 25 4-4毛蕨叶 6 9.48 41.85 0.275 0.047 5 0.034 25 A点-毛蕨叶 6.2 6.355 46.85 0.53 0.317 5 0.129 75 垂-3毛蕨叶 2.85 77.38 24.6 0.202 5 0.23 0.012 5 垂-1夹竹桃叶 12.185 46.131 23.92 0.303 71 0.987 46 0.019 574 垂-3夹竹桃叶 9.805 395.39 23.806 0.439 035 1.235 9 0.021 699 2-6夹竹桃叶 11.77 213.68 25.026 0.157 06 0.788 02 0.021 383 2-9夹竹桃叶 6.69 4.181 4 22.023 0.133 815 0.218 54 0.017 231 3-6夹竹桃叶 9.175 11.455 23.675 0.317 5 1.567 5 0.024 25 2-4夹竹桃叶 15.225 123.38 35.1 0.55 0.34 0.117 25 A点-夹竹桃叶 13.9525 16.557 5 31.05 0.507 5 0.306 075 0.021 575 垂-1茅草叶 7.44 2.365 6 20.075 0.510 205 0.330 96 0.033 292 3-5茅草叶 7.68 1.093 2 20.568 0.483 9 0.169 22 0.026 018 2-5茅草叶 13.025 9.999 4 12.182 0.070 14 0.467 4 0.024 9 2-7茅草叶 9.415 3.683 2 25.333 0.316 93 0.382 3 0.016 893 2-9茅草叶 4.225 1.275 4 10.309 0.120 17 0.258 26 0.034 701 1-6茅草叶 12.475 1.708 8 17.156 0.224 085 0.319 66 0.016 965 4-4茅草叶 10.875 1.265 0 15.575 0.352 5 0.215 0.037 25 3-7茅草叶 8.375 1.082 5 19.025 0.857 5 0.245 0.085 75 4-5茅草叶 9.725 1.315 0 19.05 0.155 0.145 0.028 75
下载: 导出CSV
表 7 矿区植被叶片成矿金属元素质量分数与对应光谱吸收深度值间的拟合方程
Table 7. Fitting equation between metallogenic metal content and spectral absorption depth of vegetation leaves
金属元素 回归方程 复相关系数R2 Co y=-5.95-296.953x1+286.812x2+40.07x3-29.43x4-3.98x5 0.85 Ni y=-3.65-52.764x1+90.07x2-21.98x3-17.05x4+8.65x5 0.83 Cu y=9.867-67.842x1+254.365x2-186.09x3+56.893x4-20.01x5 0.86 Pb y=420.09-1 976.763x1+9 109.278x2-13 045.431x3+3 091.83x4-1 500.09x5 0.88 Zn y=121.645+7 089.15x1-5 102.34x2-2 349.03x3+60.235x4+231.09x5 0.96 Mo y=15.43-71.84x1+29.03x2+40.14x3-31.15x4+38.62x5 0.92
下载: 导出CSV
-
[1] 史超, 张远龙, 任正情, 等.福建矾山Hyperion高光谱数据预处理及效果评价[J], 地质科技情报, 2014, 33(1):199-204. http://www.wanfangdata.com.cn/details/detail.do?_type=perio&id=dzkjqb201401030 [2] 万余庆, 谭克龙, 周日平.高光谱遥感应用研究[M].北京:科学出版社, 2006. [3] Clark R N, Swayze G A, Gallagher A.Mapping the mineralogy and lithology of canyonlands.Utah with imaging spectrometer data and the multiple spectral feature mapping algorithm[C]//Anon.Summaries of the Third Annual JPL airborne geosciences workshop.[S.l.]: JPL Public Publication, 1992: 9-14. [4] Rockwell B W, Clark R N, Livo K E, et al.Preliminary materials mapping in the Park City region for the Utah USGS-EPA Imaging Spectroscopy Project using both high and low altitude AVIRIS data[C]//Anon.Summaries of the 8th Annual JPL Airborne Earth Science Workshop, RO Green, NASA-JPL, Pasadena, USA.[S.l.]: [s.n.], 1999: 365-375. [5] 吕凤军, 郝跃生, 王娟, 等.植被覆盖区高光谱蚀变矿物信息提取[J].吉林大学学报:地球科学版, 2011, 41(1):316-321. [6] 陈圣波, 刘彦丽, 杨倩.植被覆盖区卫星高光谱遥感岩性分类[J].吉林大学学报:地球科学版, 2012, 42(6):1959-1965. [7] 高建阳.Hyperion高光谱数据在福建钟腾铜钼矿区的应用研究[J].国土资源遥感, 2011, 66(1):87-90. http://www.wanfangdata.com.cn/details/detail.do?_type=perio&id=gtzyyg201101017 [8] 詹云军, 胡光道, 吴艳艳.基于高光谱粗糙集分析的矿化信息挖掘[J].地质科技情报, 2009, 28(3):63-66. http://www.wanfangdata.com.cn/details/detail.do?_type=perio&id=dzkjqb200903011 [9] 梁丹迪, 周可法, 王珊珊, 等.不同空间分辨率高光谱遥感数据对蚀变矿物信息提取的影响[J].地质科技情报, 2019, 38(3):282-289. http://www.wanfangdata.com.cn/details/detail.do?_type=perio&id=dzkjqb201903031 [10] Bi Xiaojia, Miao Fang, Wu Bin, et al.Hyperion hyperspectral remote sensing application in altered mineral mapping in East Kunlun of the Qinghai-Tibet Plateau[C]//Anon.2010 International Conference on Challenges in Environmental Science and Computer Engineering.Kunming: [s.n.], 2010: 519-523. [11] Boardman J W.Mineralogic and geochemical mapping at Virginia City, Nevada using 1995 AVIRIS data[C]//Anon.Proceedings of the twelfth thematic conference on geological remote sensing, environmental research institute of michigan, Denver.[S.l.]: [s.n.], 1997: 21-28. [12] Griffin M K, Hsu S M, Burke H K, et al.Examples of EO-1 hyperion data analysis[J].Lincoin Laboratory Journal, 2005, 15(2):271-299. [13] Barry P.EO-1 hyperion science data user's guide[R].Redondo Beach, CA: TRW Space, Defense & Inform., Syst., 2001. [14] Corsini G, Piani M, Walzel T.Striping removal in MOS-B data[J].IEEE Transactions on Geoscience and Remote Sensing 2000, 38(3):1349-1446. http://www.wanfangdata.com.cn/details/detail.do?_type=perio&id=ef273cdfd1109044c6672c7f5390c44a [15] Acito N, Diani M, Corsini G.Subspace-based striping noise reduction in hyperspectral images[J].IEEE Transactions on Geoscience and Remote Sensing, 2011, 49(4):1325-1342. doi: 10.1109/TGRS.2010.2081370 [16] Beck R.EO-1 user guide version 2.3[R/OL].(2003-07-15)[2019-01-20].http://eol.usgs.gov&.http://ecol.gsfs.mara.gov, 2003. [17] Datt B, McVicar T R, Tom G, et al.Preprocessing EO-1 hyperion hyperspectral data to support the application of agricultural indexes[J].IEEE Transactions on Geoscience and Remote Sensing, 2003, 41(6):1246-1259. doi: 10.1109/TGRS.2003.813206 [18] Goodenough D G, Dyk A, Niemann K O.Processing hyperion and ALI for forest classification[J].IEEE Transactions on Geoscience and Remote Sensing, 2003, 41(6):1321-1331. http://www.wanfangdata.com.cn/details/detail.do?_type=perio&id=3d50c16f884c17dabefe3893bca61281 [19] Petropoulos G P, Arvanitis K, Sigrimis N.Hyperion hyperspectral imagery analysis combined with machine learning classifiers for land use cover mapping[J].Expert Systems with Applications, 2011, 39:3800-3809. http://www.wanfangdata.com.cn/details/detail.do?_type=perio&id=7abb404a55e6cc472590cd211767db08 [20] Kokaly R F, Clark R N.Spectroscopic determination of leaf biochemistry using band-depth analysis of absorption features and stepwise multiple linear regression[J].Remote Sensing of Environment, 1999, 67(3):267-287. doi: 10.1016/S0034-4257(98)00084-4 [21] 刘圣伟, 甘甫平, 王润生.用卫星高光谱数据提取德兴铜矿区植被污染信息[J].国土资源遥感, 2004, 59(1):6-10. http://www.wanfangdata.com.cn/details/detail.do?_type=perio&id=gtzyyg200401002 [22] 甘甫平, 刘圣伟, 周强.德兴铜矿矿山污染高光谱遥感直接识别研究[J].地球科学:中国地质大学学报, 2004, 29(1):119-126. http://www.wanfangdata.com.cn/details/detail.do?_type=perio&id=dqkx200401020 [23] 李娜, 吕建升.光谱分析在植被重金属污染监测中的应用[J].光谱学与光谱分析, 2010, 30(9):2508-2511. http://www.wanfangdata.com.cn/details/detail.do?_type=perio&id=gpxygpfx201009047 [24] 李婷, 刘湘南, 刘美玲.水稻重金属污染胁迫光谱分析模型的区域应用与验证[J].农业工程学报, 2012, 28(12):176-182. http://www.wanfangdata.com.cn/details/detail.do?_type=perio&id=nygcxb201212029 [25] 薛喜成, 陈菲.小峪河金矿区土壤、植被重金属污染研究[J].西北农林科技大学学报:然科学版, 2013, 41(8):1-8. http://www.wanfangdata.com.cn/details/detail.do?_type=perio&id=xbnydxxb201308022 [26] 任红艳, 庄大方, 潘剑君, 等.重金属污染水稻的冠层反射光谱特征研究[J].光谱学与光谱分析, 2010, 30(2):430-434. http://www.wanfangdata.com.cn/details/detail.do?_type=perio&id=gpxygpfx201002032 [27] 李庆亭, 杨锋杰, 张兵, 等.重金属污染胁迫下盐肤木的生化效应及光谱特征[J].遥感学报, 2008, 12(2):284-290. [28] Van D, Meer F.Analysis of spectral absorption features in hyperspectral imagery[J].International Journal of Applied Earth Observation and Geoinformation, 2004, 5(1):55-68. doi: 10.1016/j.jag.2003.09.001 -

 下载:
下载:


 点击查看大图
计量
- 文章访问数: 387
- PDF下载量: 393
- 被引次数: 0
