


Chemical characteristics and formation mechanism of shallow groundwater in the northern Henan Plain
-
摘要: 地下水的化学特征与成因机制对地下水演化、地下水资源的合理开采及质量评价具有重要意义。为查明豫北平原浅层地下水的水质特征及控制因素,采集了不同类型的浅层地下水和地表水样品,分别测试了水样阴、阳离子和氢氧同位素组成。结果表明:①地下水中总溶解性固体物质(total dissolved solids,简称TDS)质量浓度范围为316~6 948 mg/L,微咸和咸地下水呈条带状分布在沁河冲洪积平原中部,在三阳镇-修武县一带,水化学类型复杂,以HCO3·SO4-Na·Mg·Ca型和SO4-Na·Mg型水为主。北部山前冲洪积扇和沁河北岸地下水为淡水,为HCO3-Ca·Mg型水。②δ2H-δ18O关系说明地下水起源于大气降水,水化学组分受水岩相互作用控制,在补给区以碳酸盐岩溶滤作用为主,径流区发生硅酸盐岩的风化溶解以及阳离子交换作用,排泄区以蒸发浓缩、石膏溶解和阳离子交换作用为主。③地质和气候环境是造成地下水咸化的主要成因,且受到工农业污水渗漏的影响。研究成果可以为该区地下水资源的合理开采和有效管理提供依据。Abstract: The chemical components and formation mechanism are of great significance for groundwater evolution, reasonable exploitation, and the quality evaluation of water resources.To clarify the water quality characteristics and its control factors of shallow groundwater in the northern Henan Plain, different types of water samples were collected, and the anion, cation and hydrogen and oxygen isotopic compositions of the water samples were tested, respectively.The results show that: ① The range of groundwater TDS is 316-6 948 mg/L, and the brackish and saline groundwater are in the center of alluvial and diluvial plain of Qinhe river, along the area of Sanyang Town to Xiuwu County, with the major water types of HCO3·SO4·Cl-Na·Mg and SO4-Na·Mg.In the northern alluvial fan landform and the north shore of Qinhe River, groundwater is freshen with the water type of HCO3-Ca·Mg.② The hydrogen and oxygen isotopic composition of groundwater indicates that groundwater originates from atmospheric precipitation and the evolution of chemical components are dominated by water-rock interactions.The groundwater is controlled by carbonate leaching in the recharge area, the weathering of silicate and cation exchange occur in the runoff area, and the drainage area is dominated by evaporation, gypsum dissolution and concentration and cation exchange.To a certain extent, it is also affected by human activities.③ The geological condition and climate are the main cause of the formation of saline groundwater, and also it is affected by leakage of industrial and agricultural sewage.The results can provide a basis for the rational exploitation and offective management of groundwater resources in this area.
-
Key words:
- northern Henan Plain /
- groundwater /
- hydrochemical characteristics /
- recharger /
- water-rock interaction
-

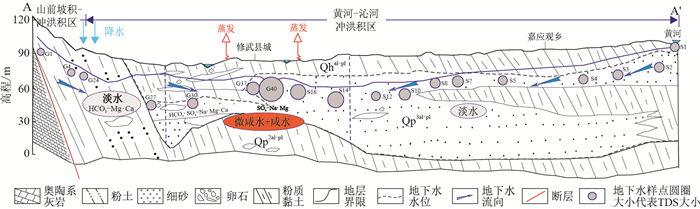
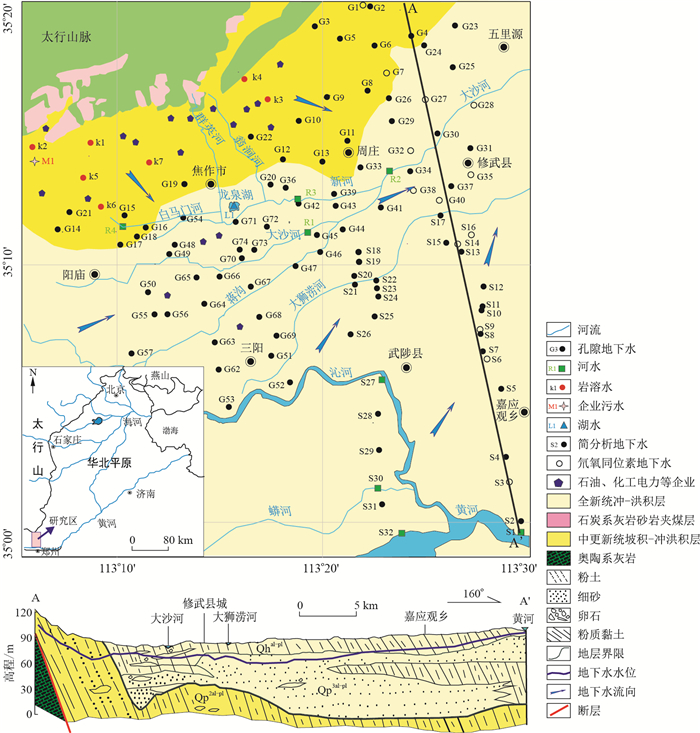
图 1 研究区地层、剖面图及水样采集点
Figure 1. Stratum, profile, and water sample′s location of the study area

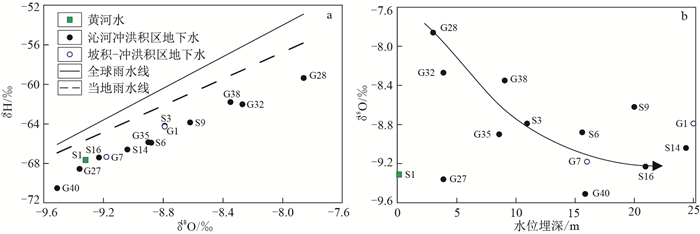
图 2 研究区水样δ2H vs.δ18O (a)、δ18O vs.地下水位埋深(b)关系图
Figure 2. δ2H vs.δ18O diagram (a) and δ218 vs.groundwater level depth (b) of the water samples in the study area

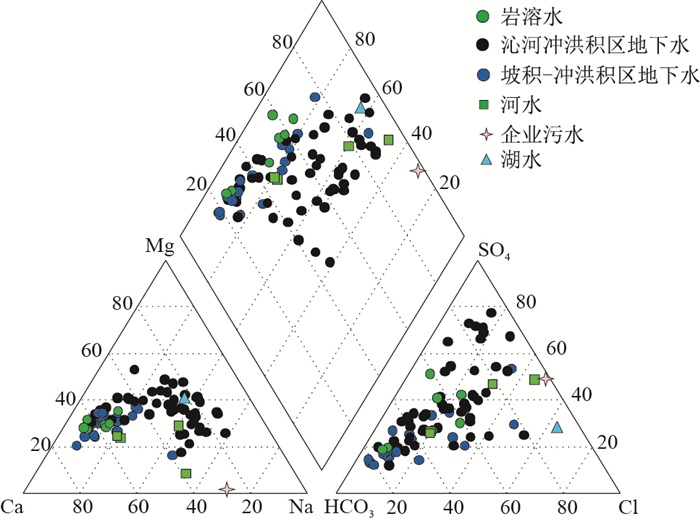
图 3 研究区水样Piper三线图
Figure 3. Piper diagram of groundwater and surface water samples of the study area


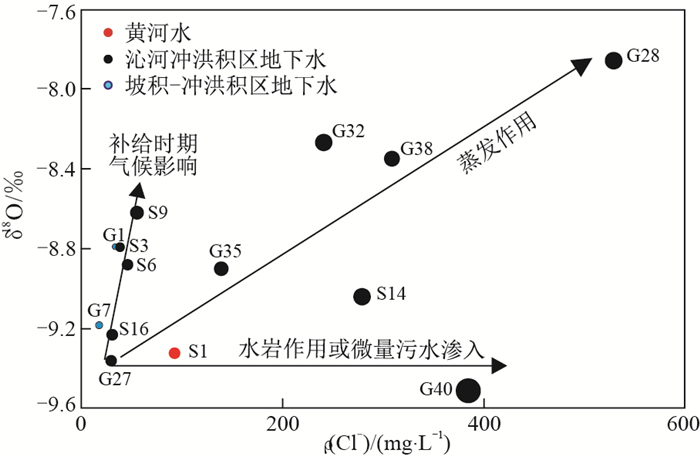
图 7 地下水δ18O与ρ(Cl-)关系图(圆圈大小示意TDS大小)
Figure 7. Plot of the relationship between δ18O and Cl- concentration of the groundwater (the size of bubble indicates TDS)

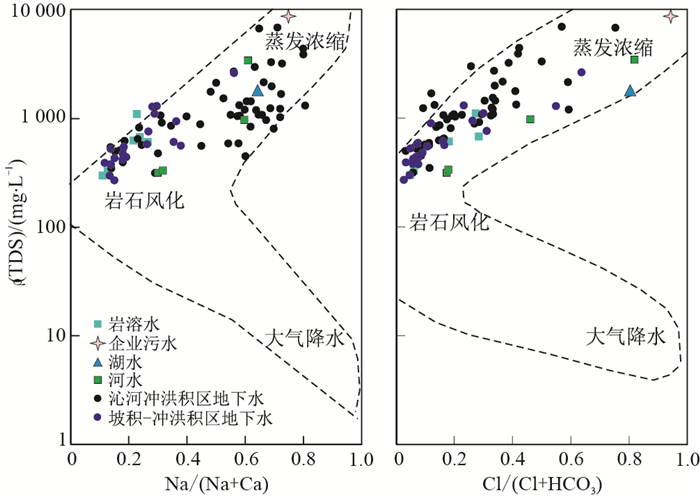
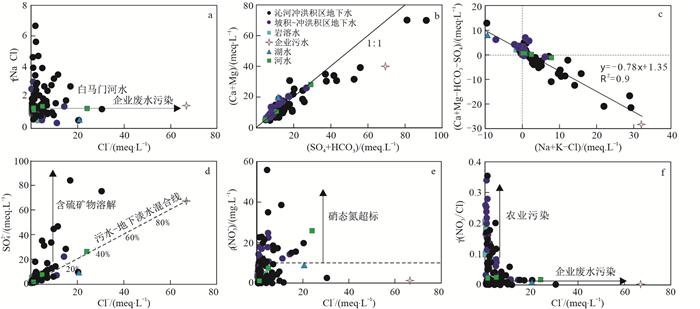
图 8 研究区水样离子比例关系图
Figure 8. Plot of the relationship between ions of the water samples in the study area
表 1 研究区水样氢氧同位素测试结果
Table 1. Hydroxide isotopes test of water samples of the study area
水样编号 S1 S3 S6 S9 S14 S16 G40 G38 G35 G32 G28 G27 G1 G7 黄河水 沁河冲洪积区地下水 坡积-冲洪积区地下水 δ2H/‰ -67.7 -64.2 -65.9 -63.9 -66.6 -67.4 -70.5 -61.8 -65.9 -62.0 -59.4 -68.6 -64.3 -67.3 δ18O/‰ -9.3 -8.8 -8.9 -8.6 -9.0 -9.2 -9.5 -8.4 -8.9 -8.3 -7.9 -9.4 -8.8 -9.2  下载: 导出CSV
表 2 不同地貌单元地下水及地表水化学组分测试结果
Table 2. Chemical composition of surface water and groundwater in different geomorphologic units
编号 地貌区 pH Na+ K+ Ca2+ Mg2+ Cl- SO42- HCO3- NO3- 可溶Si TDS ρB/(mg·L-1) k1 岩溶水 7.5 37.2 1.82 135 42.7 56.8 212 288 5.33 16.8 634.9 k2 岩溶水 7.6 14.3 1.83 121 37.6 22.6 219 224 7.07 15.3 535.4 k3 岩溶水 7.6 12.1 1.38 82.7 21.7 17.7 58.6 270 3.11 13.9 332.3 k4 岩溶水 7.6 9.62 1.15 77.8 20.7 12.9 51.2 253 4.58 14.4 304.5 k5 岩溶水 7.1 68.1 3.12 231 70.7 150.0 383 398 3.01 19.8 1 107.9 k6 岩溶水 7.4 43.3 0.926 120 52.7 77.5 142 349 12.10 28.2 623.0 k7 岩溶水 7.5 43.7 1.94 140 46.8 120.0 175 302 4.39 18.7 682.8 G1 坡积-冲洪积区 7.4 16.6 1.02 103 27.4 25.3 51.7 304 8.81 21.7 385.8 G2 坡积-冲洪积区 7.5 14.2 0.493 107 19.0 13.5 49.4 377 0.76 24.4 392.9 G3 坡积-冲洪积区 7.6 11.9 0.945 67.2 20.5 7.16 36.2 254 3.24 12.9 274.1 G4 坡积-冲洪积区 7.3 25.3 1.37 116 40.5 36.7 74.4 367 17.90 22.0 495.7 G5 坡积-冲洪积区 7.8 12.6 1.12 81.2 21.9 13.5 32.9 272 3.89 15.3 303.1 G6 坡积-冲洪积区 7.5 15.4 1.57 97.5 32.6 19.4 57 314 8.58 17.3 389.1 G7 坡积-冲洪积区 7.3 19.4 1.85 109 40.6 24.1 67.6 341 14.30 24.2 447.4 G8 坡积-冲洪积区 7.3 22.2 2.28 102 39.1 21.4 65.2 341 8.89 22.6 431.6 G9 坡积-冲洪积区 7.1 23.5 4.36 147 33.1 19.3 117 366 0.05 20.4 527.3 G10 坡积-冲洪积区 7.4 24.3 0.832 109 34.3 28.6 67 341 7.66 23.5 442.2 G11 坡积-冲洪积区 7.4 24.8 1.95 105 39.0 26.6 70.8 350 10.10 27.4 453.3 G12 坡积-冲洪积区 7.2 60.2 0.85 169 60.3 30.7 65.9 391 6.12 24.9 588.6 G13 坡积-冲洪积区 7.0 63.9 1.12 273 64.8 72.3 159 531 17.00 28.9 916.6 G14 坡积-冲洪积区 7.1 467 1.76 365 92.6 506 1060 289 14.30 26.4 2 651.2 G15 坡积-冲洪积区 7.3 91.2 1.76 225 67.4 182 333 424 10.70 23.6 1 123.1 G16 坡积-冲洪积区 6.9 114 9.12 271 82.6 175 370 577 22.50 30.7 1 332.7 G17 坡积-冲洪积区 7.3 59.2 1.46 108 48.4 62.1 171 322 5.69 26.5 616.9 G18 坡积-冲洪积区 7.2 92.3 0.76 162 87.9 171 194 480 24.80 28.1 972.8 G19 坡积-冲洪积区 7.1 58 0.705 159 61.5 166 135 367 17.80 28.7 781.5 G20 坡积-冲洪积区 7.5 58.1 0.554 95.4 50.3 81.9 73 411 2.06 21.7 566.8 G21 坡积-冲洪积区 7.3 89.8 1.15 230 83.7 393 334 323 12.20 25.8 1 305.4 G22 坡积-冲洪积区 7.3 28.6 0.52 128 30.9 46 125 381 13.10 23.7 562.6 G23 沁河冲洪积区 7.5 39.1 1.75 121 44.1 41 141 369 10.70 21.3 583.2 G24 沁河冲洪积区 7.4 25.8 1.48 127 46 36.7 86.4 376 22.70 23.4 534.1 G25 沁河冲洪积区 7.5 31 1.70 136 58.1 65.7 143 379 10.70 28.4 635.7 G26 沁河冲洪积区 7.4 20.5 2.24 93.9 35.8 21.2 65.4 316 6.30 21.8 403.3 G27 沁河冲洪积区 7.3 40.2 1.56 134 71.7 73.8 142 375 22.90 27.0 673.7 G28 沁河冲洪积区 7.0 246 1.21 246 221 721 460 501 19.80 17.1 2 165.5 G29 沁河冲洪积区 7.2 26.5 3.22 121 45.4 29.8 102 393 6.93 31.4 531.4 G30 沁河冲洪积区 7.3 137 1.02 84.6 71.9 74.8 242 466 1.77 23.0 846.1 G31 沁河冲洪积区 7.1 268 0.202 165 83.8 232 434 530 5.29 19.2 1 453.3 G32 沁河冲洪积区 7.2 395 1.81 177 117 250 806 487 9.42 20.3 1 999.7 G33 沁河冲洪积区 7.2 49.9 1.21 162 86.8 92.2 150 573 11.90 20.8 840.5 G34 沁河冲洪积区 6.9 398 15.8 202 170 376 681 651 38.60 19.5 2 206.9 G35 沁河冲洪积区 7.2 335 0.601 80.8 79.2 110 357 719 2.14 17.0 1 324.2 G36 沁河冲洪积区 7.1 126 0.54 157 83.6 160 146 434 56.20 20.7 946.3 G37 沁河冲洪积区 7.2 270 0.874 105 74.6 74.2 351 719 9.33 21.1 1 244.5 G38 沁河冲洪积区 7.2 217 0.65 234 163 319 609 460 17.30 26.4 1 790.0 G39 沁河冲洪积区 7.3 37.1 1.07 86.5 50.4 40 54 422 3.46 25.6 483.5 G40 沁河冲洪积区 7.8 930 1.6 234 330 411 2 240 561 0.40 23.5 4 427.5 G41 沁河冲洪积区 7.3 232 2.41 156 47.5 185 402 372 2.22 20.2 1 213.1 G42 沁河冲洪积区 7.4 193 1.79 140 126 345 282 491 5.76 16.7 1 339.1 G43 沁河冲洪积区 7.4 234 2.6 107 99.7 241 319 493 2.83 15.9 1 252.6 G44 沁河冲洪积区 7.1 626 1.63 283 249 533 1 360 533 15.00 21.4 3 334.1 G45 沁河冲洪积区 6.7 248 17.1 162 79.5 234 480 453 < 0.01 14.8 1 447.1 G46 沁河冲洪积区 7.3 730 2.46 183 269 349 2 140 484 1.25 22.0 3 916.7 G47 沁河冲洪积区 7.3 565 1.57 213 280 311 1 610 493 4.34 20.5 3 231.4 G48 沁河冲洪积区 7.5 80.8 1.49 53.7 25.7 27 120 286 0.69 22.9 452.4 G49 沁河冲洪积区 7.5 76.5 1.32 171 98.6 144 336 492 0.14 17.1 1 073.6 G50 沁河冲洪积区 7.6 78 1.59 148 86.1 90.3 202 512 19.80 29.2 881.8 G51 沁河冲洪积区 7.5 141 1.19 61.1 44.7 63.2 362 273 0.09 24.4 809.8 G52 沁河冲洪积区 7.7 18.1 0.46 44.3 41.7 17.2 57.7 274 < 0.01 22.5 316.5 G53 沁河冲洪积区 7.6 19.3 0.807 107 42 15.5 93.2 443 0.15 24.0 499.5 G54 沁河冲洪积区 7.2 78 1.4 171 67.1 149 268 373 10.70 9.9 931.7 G55 沁河冲洪积区 7.5 78.1 0.625 66.1 62.7 54.1 120 421 5.08 23.6 597.2 G56 沁河冲洪积区 7.6 61.7 1.43 75.7 60.9 49.9 119 388 6.47 26.0 569.1 G57 沁河冲洪积区 7.4 102 0.587 154 98.6 116 336 487 21.50 18.6 1 072.2 G58 沁河冲洪积区 7.8 177 0.796 86.5 64.3 92.7 333 436 2.50 22.0 974.8 G59 沁河冲洪积区 7.4 82.6 1 60.6 44.9 32.4 174 396 0.83 24.0 594.3 G60 沁河冲洪积区 7.4 126 0.798 90.7 109 78.1 462 401 1.06 23.5 1 068.2 G61 沁河冲洪积区 7.4 19.2 0.908 121 43.2 26.3 148 376 < 0.01 24.0 546.6 G62 沁河冲洪积区 7.3 145 0.986 108 92.3 204 295 422 2.91 23.3 1 059.2 G63 沁河冲洪积区 7.4 282 0.894 108 138 65.4 860 473 2.25 20.8 1 693.0 G64 沁河冲洪积区 7.4 175 0.894 68.1 95.3 126 320 494 8.64 21.0 1 040.9 G65 沁河冲洪积区 7.0 167 1.35 151 172 254 541 510 16.30 19.7 1 557.7 G66 沁河冲洪积区 7.7 225 10.5 128 53.7 227 479 156 3.07 0.2 1 204.3 G67 沁河冲洪积区 7.3 357 1.17 280 196 202 1 490 398 1.53 21.0 2 726.7 G68 沁河冲洪积区 7.2 434 1.36 252 217 171 1 680 493 12.30 22.5 3 014.2 G69 沁河冲洪积区 7.2 1060 2.89 432 580 600 4 030 455 15.60 21.0 6 948.0 G70 沁河冲洪积区 7.3 149 0.653 122 94.3 150 268 604 3.67 15.4 1 089.6 G71 沁河冲洪积区 7.5 152 0.532 83.4 120 249 235 498 18.60 18.8 1 107.5 G72 沁河冲洪积区 7.6 13.4 0.663 82.5 25.1 35 58.2 268 4.29 15.7 353.2 G73 沁河冲洪积区 7.0 877 2.35 477 555 1 080 3 610 355 2.61 14.2 6 781.5 G74 沁河冲洪积区 7.5 184 0.289 95.8 65.9 175 356 418 0.88 19.4 1 086.9 R1 大沙河上游水 7.3 164 6.63 111 63.5 175 356 205 1.63 4.2 980.3 R2 大沙河下游水 7.5 33.5 3.9 72 19.5 39.1 71.8 182 3.78 9.7 334.6 R3 新河水 7.5 29.8 3.79 69.8 19.2 38.4 68.1 180 3.79 9.2 322.9 R4 白马门河水 7.1 711 33.5 454 63.3 853 1 250 190 16.50 7.4 3 476.3 M1 企业污水 7.0 2 240 59.1 759 28 2 370 3 210 144 < 0.01 9.5 8 738.1 L1 湖水 7.7 253 3.65 141 147 727 412 178 0.18 11.4 1 772.8
下载: 导出CSV
表 3 典型剖面上地下水pH值和TDS结果
Table 3. pH and TDS of groundwater along the typical sections
S1黄河水 S2 S3 S4 S5 S6 S7 S8 S9 S10 S11 pH 8.7 8.0 7.9 7.8 7.6 8.4 7.6 7.8 7.6 7.8 7.8 ρ(TDS)/(mg·L-1) 733.4 831.9 787.5 649.4 607.4 559.2 999.7 828.9 1 234.3 1 017.0 628.1 S12 S13 S14 S15 S16 S17 S18 S19 S20 S21 S22 pH 7.8 7.7 7.7 7.7 7.5 7.45 7.9 7.3 7.7 7.7 7.5 ρ(TDS)/(mg·L-1) 597.9 859.6 2 098.5 2 521.5 1 685.4 2 207.4 3 579.8 2 288.5 2 602.2 2 428.5 2 330.2 S23 S24 S25 S26 S27 S28 S29 S30蟒河水 S31 S32黄河水 pH 8.3 8.1 8.2 8.2 8.6 7.7 7.9 8.9 8.1 8.7 ρ(TDS)/(mg·L-1) 713.1 1 594.5 624.7 496.6 818.4 1 311.6 952.8 708.4 654.7 667.0
下载: 导出CSV
-
[1] Li J, Liang X, Zhang Y N, et al. Salinization of porewater in a multiple aquitard-aquifer system in Jiangsu Coastal Plain, China[J]. Hydrogeology Journal, 2017, 25: 2377-2390. doi: 10.1007/s10040-017-1622-0 [2] 梁杏, 张婧玮, 蓝坤, 等. 江汉平原地下水化学特征及水流系统分析[J]. 地质科技通报, 2020, 39(1): 21-33. https://dzkjqb.cug.edu.cn/CN/abstract/abstract9922.shtmlLiang X, Zhang J W, Lan K, et al. Hydrochemical characteristics of groundwater and analysis of groundwater flow systems in Jianghan Plain[J]. Bulletin of Geological Science and Technology, 2020, 39(1): 21-33(in Chinese with English abstract). https://dzkjqb.cug.edu.cn/CN/abstract/abstract9922.shtml [3] Han D M, Song X F, Currell M J, et al. Chemical and isotopic constraints on evolution of groundwater salinization in the coastal plain aquifer of Laizhou Bay, China[J]. Journal of Hydrology, 2014, 508: 12-27. doi: 10.1016/j.jhydrol.2013.10.040 [4] Han D M, Post V E A, Song X F. Groundwater salinization processes and reversibility of seawater intrusion in coastal carbonate aquifers[J]. Journal of Hydrology, 2015, 531: 1067-1080. doi: 10.1016/j.jhydrol.2015.11.013 [5] Xiao Y, Shao J L, Frape S K, et al. Groundwater origin, flow regime and geochemical evolution in arid endorheic watersheds: A case study from the Qaidam Basin, northwestern China[J]. Hydrology and Earth System Sciences, 2018, 22(8): 4381-4400. doi: 10.5194/hess-22-4381-2018 [6] Zhang D, Li X D, Zhao Z Q, et al. Using dual isotopic data to track the sources and behaviors of dissolved sulfate in the western North China Plain[J]. Applied Geochemistry, 2015, 52: 43-56. doi: 10.1016/j.apgeochem.2014.11.011 [7] 赵小涛, 赵小鑫, 杜泳. 焦作黄沁河水资源可持续利用研究[J]. 河南科技, 2019, 35: 84-86. https://www.cnki.com.cn/Article/CJFDTOTAL-HNKJ201935030.htmZhao X T, Zhao X X, Du Y. Research on sustainable utilization of water resources in Jiaozuo Yellow River and Qinhe River[J]. Henan Science and Technology, 2019, 35: 84-86(in Chinese with English abstract). https://www.cnki.com.cn/Article/CJFDTOTAL-HNKJ201935030.htm [8] 张东, 刘丛强, 尹国勋. 基于稳定同位素和水化学的内陆地下水咸化过程研究: 以焦作市为例[J]. 地球与环境, 2010, 38(2): 177-183. https://www.cnki.com.cn/Article/CJFDTOTAL-DZDQ201002010.htmZhang D, Liu C Q, Yin G X. Study on inland groundwater salinization based on stable isotope and hydrochemistry: A case study in Jiaozuo City, China[J]. Earth and Environment, 2010, 38(2): 177-183(in Chinese with English abstract). https://www.cnki.com.cn/Article/CJFDTOTAL-DZDQ201002010.htm [9] 曹金亮. 豫东平原高氟水赋存形态及形成机理研究[D]. 武汉: 中国地质大学(武汉), 2013.Cao J L. The study of the storing form and the formation mechanism of the high-fluorine water in Eastern Henan Plain[D]. Wuhan: China University of Geosciences(Wuhan), 2013(in Chinese with English abstract). [10] 王刚. 郑州市北郊水源地高砷地下水的分布与形成机理初步研究[D]. 青岛: 青岛理工大学, 2011.Wang G. Preliminary research on spatial distribution and formation of high As groundwater in northern suburb groundwater source field, Zhengzhou[D]. Qingdao: Qingdao University of Technology, 2011(in Chinese with English abstract). [11] 张兆吉, 雒国中, 王昭, 等. 华北平原地下水资源可持续利用研究[J]. 资源科学, 2009, 31(3): 355-360. doi: 10.3321/j.issn:1007-7588.2009.03.001Zhang Z J, Luo G Z, Wang Z, et al. Study on sustainable utilization of groundwater in North China Plain[J]. Resources Science, 2009, 31(3): 355-360(in Chinese with English abstract). doi: 10.3321/j.issn:1007-7588.2009.03.001 [12] 高淑琴. 河南平原第四系地下水循环模式及其可更新能力评价[D]. 长春: 吉林大学, 2008.Gao S Q. Groundwater cycle pattern and renewability evaluation of groundwater in the Quaternary aquifer in Henan Plain[D]. Changchun: Jilin University, 2008(in Chinese with English abstract). [13] 赵胜楠. 河间地块浅层地下水中SO42-污染的时空分布特征研究[D]. 河南焦作: 河南理工大学, 2017.Zhao S N. The research of temporal and spatial distribution of SO42- pollution in the shallow groundwater between two drainage rivers[D]. Jiaozuo Henan: Henan Polytechnic University, 2017(in Chinese with English abstract). [14] 黄平华, 陈建生, 宁超. 焦作矿区地下水中氢氧同位素分析[J]. 煤炭学报, 2012, 37(5): 770-775. https://www.cnki.com.cn/Article/CJFDTOTAL-MTXB201205012.htmHuang P H, Chen J S, Ning C. The analysis of hydrogen and oxygen isotopes in the ground water of Jiaozuo mine area[J]. Journal of China Coal Society, 2012, 37(5): 770-775(in Chinese with English abstract). https://www.cnki.com.cn/Article/CJFDTOTAL-MTXB201205012.htm [15] Craig H. Isotopic variations in meteoric waters[J]. Science, 1961, 133: 1702-1703. doi: 10.1126/science.133.3465.1702 [16] Chen Z Y, Qi J X, Xu J M, et al. Paleoclimatic interpretation of the past 30 ka from isotopic studies of the deep confined aquifer of the North China Plain[J]. Applied Geochemistry, 2003, 18: 997-1009. doi: 10.1016/S0883-2927(02)00206-8 [17] Liu J R, Song X F, Yuan G F, et al. Stable isotopic compositions of precipitation in China[J/OL]. Tellus B: Chemical and Physical Meteorology, 2014, 66(1). doi: org/10.3402/tellusb.v66.22567. [18] Gibbs R J. Mechanisms controlling world water chemistry[J]. American Association for the Advancement of Science, 1970, 170: 1088-1090. doi: 10.1126/science.170.3962.1088 [19] 刘江涛, 蔡五田, 曹月婷, 等. 沁河冲洪积扇地下水水化学特征及成因分析[J]. 环境科学, 2018, 39(12): 5428-5439. https://www.cnki.com.cn/Article/CJFDTOTAL-HJKZ201812016.htmLiu J T, Cai W T, Cao Y T, et al. Hydrochemical characteristics of groundwater and the origin in alluvial proluvial fan of Qinhe Rive[J]. Environmental Science, 2018, 39(12): 5428-5439(in Chinese with English abstract). https://www.cnki.com.cn/Article/CJFDTOTAL-HJKZ201812016.htm [20] Warner N R, Jackson R B, Darrah T H, et al. Geochemical evidence for possible natural migration of Marcellus Formation brine to shallow aquifers in Pennsylvania[J]. Proceedings of the National Academy of Sciences, 2012, 109(30): 11961-11966. doi: 10.1073/pnas.1121181109 [21] Li J, Liang X, Jin M G, et al. Origin and evolution of aquitard porewater in the western coastal plain of Bohai Bay, China[J]. Groundwater, 2017, 55(6): 917-925. doi: 10.1111/gwat.12590 [22] Intissar F, Rim T, Kamel Z, et al. Hydrogeochemical processes affecting groundwater in an irrigated land in Central Tunisia[J]. Environmental Earth Sciences, 2013, 68(5): 1215-1231. doi: 10.1007/s10661-013-3113-7/ [23] Fan B L, Zhao Z Q, Tao F X, et al. Characteristics of carbonate, evaporite and silicate weathering in Huanghe River Basin: A comparison among the upstream, midstream, and downstream[J]. Journal of Asian Earth Sciences, 2014, 96: 17-26. doi: 10.1016/j.jseaes.2014.09.005 [24] 张维理, 田哲旭, 张宁, 等. 我国北方农用氮肥造成地下水硝酸盐污染的调查[J]. 植物营养与肥料学报, 1995, 1(2): 82-89. https://www.cnki.com.cn/Article/CJFDTOTAL-ZWYF199502011.htmZhang W L, Tian Z X, Zhang N, et al. Investigation of nitrate pollution in groundwater due to nitrogen fertilization in agriculture in north China[J]. Plant Nutrition and Fertilizer Sciences, 1995, 1(2): 82-89(in Chinese with English abstract). https://www.cnki.com.cn/Article/CJFDTOTAL-ZWYF199502011.htm [25] 方传棣, 成金华, 赵鹏大, 等. 长江经济带矿区土壤重金属污染特征与评价[J]. 地质科技情报, 2019, 38(5): 230-239. https://www.cnki.com.cn/Article/CJFDTOTAL-DZKQ201905025.htmFang C D, Cheng J H, Zhao P D, et al. Characteristics and evaluation of heavy metal pollution in soils of mine areas in the Yangtze River economic belt[J]. Geological Science and Technology Information, 2019, 38(5): 230-239(in Chinese with English abstract). https://www.cnki.com.cn/Article/CJFDTOTAL-DZKQ201905025.htm [26] 黄艳雯, 杜尧, 徐宇, 等. 洞庭湖平原西部地区浅层承压水中铵氮的来源与富集机理[J]. 地质科技通报, 2020, 39(6): 165-174. https://dzkjqb.cug.edu.cn/CN/abstract/abstract10082.shtmlHuang Y W, Du Y, Xu Y, et al. Source and enrichment mechanism of ammonium in shallow confined aquifer of Dongting Plain[J]. Bulletin of Geological Science and Technology, 2020, 39(6): 165-174(in Chinese with English abstract). https://dzkjqb.cug.edu.cn/CN/abstract/abstract10082.shtml -

 下载:
下载:


 点击查看大图
计量
- 文章访问数: 1015
- PDF下载量: 335
- 被引次数: 0
