


Aster geological mapping based on multi-scale texture classification and mineral recognition
-
摘要:
遥感技术已经成为基础地质调查必不可少的手段。为提高地质填图效率及精度, 本研究提出了基于ASTER的岩性自动分类加主要和典型造岩矿物识别的填图方法。首先, 对ASTER数据进行主成分变换, 对选取的第一主分量采用Haar小波进行多尺度小波分解, 将小波系数的统计特征作为纹理特征, 构建纹理及光谱多维特征空间; 接着, 运用支持向量机(SVM)进行岩性分类; 同时, 根据光谱特征提取主要造岩矿物; 最后将主要造岩矿物叠加在分类结果上, 结合野外调查背景进行岩性填图。混淆矩阵结果显示光谱+小波纹理分类精度可以达到83.496 2%, 较光谱+灰度共生矩阵纹理分类精度提高了2.675 6%, 较光谱特征分类精度提高了6.318 9%。与最大似然法(MLC)分类相比, SVM分类精度提高了6.623 7%。矿物提取结果表明, 构造的提取指数可有效提取白云母、黑云母、方解石、角闪石等矿物。野外工作证明, 填图结果与野外调查结果的相关系数为0.7, 可见, 基于ASTER数据利用图像处理技术、机器学习算法及波段运算可作为植被覆盖较少地区有效的地质填图手段。
Abstract:Remote sensing technology has become an indispensable means in geological survey. In order to improve the efficiency and accuracy of geological mapping, a method based on Aster automatic lithology classification combined with the identification of main rock forming minerals is proposed in this study. Firstly, the principal component transform of ASTER data is carried out, the first principal component is selected for multi-scale Haar wavelet decomposition, and the statistical characteristics of wavelet coefficients are taken as texture features to construct multi-dimensional feature space of texture and spectrum; Then, support vector machine is adopted to classify lithology; At the same time, the main rock forming minerals are extracted according to the spectral characteristics; Finally, the main rock forming minerals are superimposed on the classification results, and the lithology mapping is completed in combination with the field investigation background. The confusion matrix results show that the classification accuracy of spectrum- wavelet texture can reach 83.496 2%, which is 2.675 6% higher than that of spectrum-gray level co-occurrence matrix texture classification and 6.3189% higher than that of spectral feature classification. Compared with the maximum likelihood classification method, the classification accuracy of SVM is improved by 6.623 7%. The mineral extraction results indicate that the extraction index of structure can effectively extract muscovite, biotite, calcite, amphibole and other minerals. It can be seen that image processing technology, machine learning algorithm and band operation can be used as effective means of remote sensing mapping in areas with less vegetation coverage.
-
Key words:
- geological mapping /
- wavelet transform /
- multi-scale texture /
- support vector machine /
- mineral recognition /
- ASTER
-
岩性填图是遥感影像地质应用的主要研究方向之一。遥感岩性解译的主要依据为岩性光谱及纹理特征,特征性光谱可以直接区分造岩矿物,对造岩矿物进行组合可以辅助识别不同岩性,纹理可间接区分岩性。目前利用遥感技术开展了大量的基础地质调查和矿产勘查工作,尤其是矿物蚀变信息提取及岩性识别取得了一系列成果[1-4]。ASTER具有14个波段的影像,光谱分辨率较高,在短波红外波段,含OH的层状硅酸盐矿物及碳酸盐矿物具有鉴定性光谱特征,而在热红外波段,石英、方解石等重要造岩矿物具有鉴定性光谱特征。基于ASTER的岩性填图多侧重于基于光谱特征利用波段比值、假彩色合成及匹配滤波法等图像处理技术识别部分岩性,如花岗岩类、碳酸盐类等,或者提取主要造岩矿物,如白云母、方解石、石英等,并据此完成填图工作[5-6]。
采用有效的机器学习算法进行遥感影像岩性自动分类可提高填图效率。最大似然法(maximum likelihood classification, 简称MLC)是常用的岩性分类方法,但支持向量机(SVM)在小样本及训练数据非正态分布的情况下性能更优[7],SVM已成功地应用于遥感影像分类[8]。基于ASTER影像的光谱特征进行岩性分类将像素视为独立的对象,没有考虑像素的邻域信息,而岩性的纹理特征描述了像素的邻域关系,有助于提高分类性能[9]。常用的岩性纹理特征提取方法有灰度共生矩阵、变差函数[10]及小波变换法[11]等。在高分辨率遥感影像中,不同岩性单元由于矿物组成、后期蚀变和风化等导致岩性的坡向、形态及粗糙度等的差异表现出明显的多尺度纹理特征,而小波变换是有效的多尺度分析工具,能更好地表现高分影像的局部特征,因此,可将小波变换提取的纹理特征结合到光谱特征中进行岩性分类。
东天山尾亚地区属于干旱-荒漠地区,岩性出露良好,并具有诊断性光谱及结构特征。本研究旨在探索该类型区域ASTER数据填图的有效性。利用ASTER数据的小波纹理特征及光谱特征建立多维特征空间,采用SVM进行岩性分类,再结合矿物提取结果完成岩性填图工作。
1. 地质背景
中天山地块是中亚造山带众多具有古老基底的微陆块之一,位于塔里木克拉通和西伯利亚克拉通之间,是古亚洲构造域的重要组成部分,也是研究中亚造山带地壳演化和碰撞过程的重要构造部位。研究区位于阿其克库都克断裂以南,红柳河-牛圈子构造带以北,属于中天山地块东段。区内地层涉及元古宇和古生界,岩浆活动频繁,断层发育,构造作用强烈,经历了多期次地质事件,形成了较复杂的沉积岩、变质岩和岩浆岩。根据支撑项目野外实际调查,该区出露的主要岩石单元有:古元古代片岩和片麻岩类以及大理岩、中元古代大理岩和浅变质碎屑岩、新元古代片麻岩、晚石炭世中酸性侵入岩和中三叠世基性-酸性侵入岩(图 1)。
2. 数据和方法
2.1 数据
2.1.1 ASTER数据
本研究获得的ASTER L1A影像数据于2005年10月7日拍摄,无积雪、植被覆盖,基本无云层覆盖,成像质量较好。预处理ASTER数据:使用ENVI5.3软件对影像进行辐射校正,将DN值转换成辐射值;进行几何精校正时将短波红外30 m分辨率重采样为15 m分辨率;可见光-近红外波段(VNIR)及短波红外波段(SWIR)采用FLAASH模块进行校正,而热红外波段采用热大气校正(Thermal Atmospheric Correction)模块进行大气校正。由于VNIR和SWIR波段的成像时间相差1 s,覆盖范围不完全一致,需要去除边框区域的假异常现象。
2.1.2 光谱特征
根据野外实际调查,研究区内出露的主要岩性单元有:古元古界(Pt1)、中元古界(Pt2)、下石炭统(C1)及新元古代、晚石炭世、三叠世侵入岩等(图 1)。
古元古代星星峡岩群主要岩石有:云母石英片岩、钙质片岩、斜长角闪片岩、云母长英质糜棱岩、大理岩、白云质大理岩及少量片麻岩等。其中的片岩类以富集云母矿物和石英为主要特征,所夹的大理岩以方解石矿物为主,少量的斜长角闪片岩中含角闪石矿物。可将角闪石和方解石矿物呈层出现作为该套地层的主要鉴定特征,云母矿物出现作为辅助鉴定特征。方解石信息可以通过ASTER数据波段b14/(b13+b12)进行特征增强;角闪石信息可通过(b6/b8)×(b12/b10)进行增强;白云母可通过(b5+b7)/b6进行增强[12]。
中元古代卡瓦布拉克岩群为大面积分布的大理岩和少量浅变质碎屑岩。因此,大面积方解石矿物的出现可作为其主要鉴别特征,少量辉石矿物的出现作为其辅助鉴定特征。辉石可通过ASTER数据波段b1/b3进行增强。
早石炭世雅满苏组岩性主要有:石英角斑岩、石英斑岩、英安岩、石英安山岩、安山岩、玄武岩和浅变质碎屑岩夹灰岩。浅变质碎屑岩中含有少量白云母和黑云母,玄武岩呈团块状,灰岩多呈透镜状,因此,方解石矿物和辉石矿物的团块状或零星分布,以及白云母和黑云母矿物的出现可作为该套地层的主要鉴别特征。黑云母表现为中等Mg-OH吸收特征,可通过ASTER数据波段[b12/(b11+b13)]×(b14/b11)(b为波段代号)进行增强。
新元古代片麻岩为花岗闪长质片麻岩、黑云斜长片麻岩和斜长角闪片麻岩。黑云斜长片麻岩和斜长角闪片麻岩中石英体积分数 < 5%,斜长角闪片麻岩中角闪石出现较多。因此,较多角闪石的出现可作为该套片麻岩的主要鉴别特征,少量黑云母和极少量石英信息作为辅助鉴别特征。
侵入岩主要有二长花岗岩、花岗闪长岩、石英闪长岩、石英正长岩、正长岩和辉长岩。其中,辉长岩主要矿物成分为斜长石、辉石和角闪石,以辉石的集中出现为主要鉴别特征。二长花岗岩、花岗闪长岩、石英正长岩和正长岩的矿物组成差异不明显,但主要造岩矿物体积分数差别较明显。二长花岗岩中石英体积分数约30%,花岗闪长岩中石英体积分数约20%,石英正长岩中石英体积分数约20%,正长岩中石英体积分数 < 5%;石英正长岩、正长岩和二长花岗岩中正长石体积分数>60%,而花岗闪长岩中正长石体积分数 < 15%;正长岩、二长花岗岩和花岗闪长岩都含有5%~10%的黑云母,而石英正长岩基本不含黑云母。因此,根据中酸性侵入岩主要造岩矿物体积分数变化,可以进行不同类型侵入岩的初步识别。石英的光谱信息可通过[b11/(b10+b12)]×(b13/b12)进行增强。正长石光谱特征可通过(b12+b10)/b11进行增强。主要及典型造岩矿物的吸收谱带与ASTER波段的对应关系如表 1。
表 1 矿物的吸收谱带与ASTER波段的对应关系Table 1. Correspondence relation between absorption bands of minerals and ASTER bands矿物 ASTER波段 1 2 3 4 5 6 7 8 9 10 11 12 13 14 黑云母 强吸 高反 弱反 高反 石英 强吸 高反 强吸 方解石 弱吸 强吸 高反 正长石 弱反 强吸 高反 角闪石 弱反 弱吸 强吸 强反 辉石 高反 强吸 白云母 高反 强吸 高反 2.2 方法
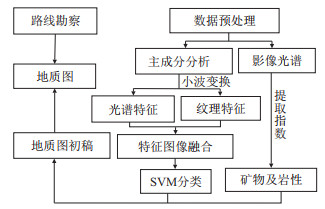
2.2.1 工作流程
基于野外调查数据的工作流程如图 2所示。首先,将预处理的ASTER影像的VNIR和SWIR波段进行主成分变换,保留所有分量作为光谱特征,对选择的第一主分量采用小波变换提取纹理特征,将光谱特征与纹理特征融合进行SVM分类;接着,构建矿物提取指数(表 2),对影像进行波段运算,提取主要造岩矿物;然后,将矿物提取结果叠加到分类结果上,结合野外调查结果综合分析判别各地质体形成填图结果。
表 2 矿物提取指数Table 2. Extraction index of minerals矿物 矿物提取指数 黑云母 [b12/(b11+b13)]×(b14/b11) 石英 [b11/(b10+b12)]×(b13/b12) 方解石 b14/(b13+b12) 正长石 (b12+b10)/b11 角闪石 (b6/b8)×(b12/b10) 辉石 b1/b3 白云母、绢云母 (b5+b7)/b6 2.2.2 波段运算
根据表 1构造主要及典型造岩矿物的提取指数(表 2)。波段运算之后目标区域得到增强,影像背景灰度差异变小。采用最大类间方差法(Otsu)搜索全局阈值,分割图像,提取矿物信息。通过形态学腐蚀处理去除孤立点、毛刺等误分割情况。
2.2.3 小波变换
为避免计算量太大、窗口效应及边缘模糊,本研究选择Haar小波基,对第一主成分的整体影像进行二维离散小波变换。选择不同移动窗口(3×3像素、7×7像素、11×11像素、15×15像素、19×19像素)提取影像f(x, y)的纹理特征,比较分类精度,最终选7×7像素窗口。小波变换之后,每级分解得4个子带图像:LL、LH、HL和HH。其中,LL包含图像的低频近似信息,LH对应水平方向上的高频成分,HL对应垂直方向的高频成分,HH包含对角方向的高频成分,高频成分即为影像的细节信息。该分解过程可在低频子带上递归进行。小波分解级数越高,图像在多尺度上的细节特征越明显,但是计算量变大,且会产生边界效应,影响分类精度。为了降低计算复杂度,本研究先进行3级小波分解,并对比不同分解层次的分类精度来确定最终分解级数。
小波变换之后,噪声、边缘及纹理都表现为高频信息,因此,在构造纹理特征向量之前,要消噪及去除边缘信息。可通过第1层细节系数估计噪声的标准偏差,选择信号噪声的全局阈值消噪。采用canny算子进行边缘检测,并将小波变换之后的高频信息与边缘检测结果进行逻辑运算去除边缘影响(式(1))。
fi(x,y) and (notg(x,y)) (1) 式中:fi(x, y)为高频子带影像;g(x, y)为边缘检测结果。
通常采用小波变换系数的统计量来描述影像的纹理特征,统计量有熵(Entropy)、均值(Mean)、标准差(Standard Deviation)、能量(Energy)等,公式见文献[13]。实验结果表明,使用这些特征的组合比单纯使用一种特征进行地物分类的精度高[14]。所以,选择子带影像的均值(μ)和标准差(S)构造纹理特征向量。实验中逐渐增加特征向量的维数,进行i级变换得到特征向量:
T=[μ11,S11,μ12,S12,μ13,S13⋯μij,Sij,μc,Sc],特征向量的维数为2×[(i×4−(i−1)] (2) 式中:μc和Sc分别为第i级分解的低频系数的均值和标准差;μij和Sij分别为第i级分解的高频系数的均值和标准差,j=1, 2, 3,分别对应水平、垂直、对角的特征值。
为了使特征向量各分量在相似度量时地位相同,需归一化各特征向量。本研究还提取了64级灰度级,7×7像素窗口的GLCM(均值同质性,异质性,熵,角二阶矩,方差,相关性,对比度)纹理。为降低计算复杂度,取0°,45°,90°,135°方向的均值作为最终的纹理特征,用以和小波变换的纹理特征进行对比。
2.2.4 支持向量机(SVM)
SVM的核心思想是通过核函数将低维空间映射到高维空间,在高维空间中搜索分隔超平面, 适合复杂地表环境的分类,它的优势为小样本分类。对影像特征进行多种组合:光谱特征(SF)、GLCM纹理特征(G-TF)、小波纹理(W-TF)、光谱加GLCM纹理(SF-G-TF)和光谱加小波纹理(SF-W-TF),对各数据源用SVM分类。参考野外调查结果,在遥感影像上不同岩性区域采集120个样点,以这120个点为中心,随机搜索周边像元,共选择17 279个像元作为训练数据集,用于训练分类器;选择20 668个像元作为验证数据集,用于分类精度评价,数据集如表 3。对不同数据源的2个数据集分别进行样本可分离性评估,转换分离度(transformed divergence, 简称TD)值均大于1.9,说明样本之间的可分离性较好,属于合格样本,可用于分类。另外,对2个数据集进行了正态性检验,结果显示为非正态分布。
表 3 岩性分类所用样本数Table 3. Sample number for lithological classification岩性 Q C1 Pt2 Pt1 T2ξ T2 ηγ T2γδ T2ξo T2υ C2ηγ C2γδ Pt3 gn 训练样本 1 706 1 737 1 469 951 1 019 1 564 1 469 316 795 1 844 3 639 770 检验样本 2 460 2 239 2 625 2 248 1 020 1 755 2 191 1 724 439 2 007 1 148 812 注:岩性同图 1 本研究所用核函数为径向基函数RBF(radial basis function),其中核参数σ2和惩罚因子C会显著影响SVM的分类精度。在不同数据源上,基于“格网搜索”模型对训练数据集采用5次交叉验证获取SVM最优分类参数[15]。各数据源的训练样本分类精度均大于98%,最优参数均为C=7,σ=0.6。
3.1 小波纹理提取结果
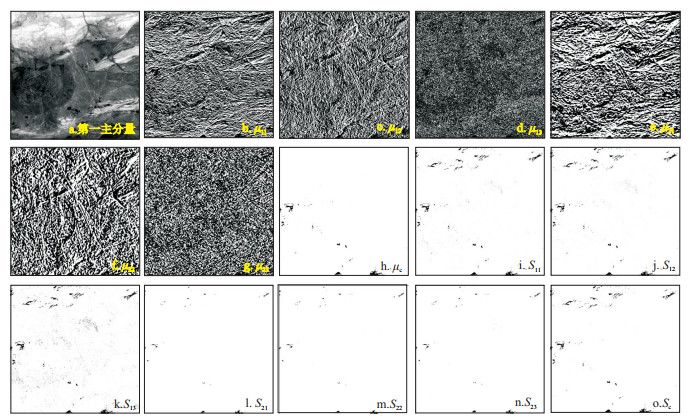
图 3-a是第一主分量图像,3-b~o是小波变换消噪并去除边缘的纹理特征。其中,图 3-b~d分别为第1级小波分解的水平、垂直、对角均值特征;图 3-e~g分别为第2级分解的3个高频子带的均值特征;图 3-h为低频子带的均值特征。与第1级纹理影像相比,第2级分解的均值纹理影像整体变亮,细节信息更加平滑。图 3-i~k为第1级小波分解的水平、垂直、对角标准差特征;图 3-l~n为第2级小波分解的3个高频子带的标准差特征;图 3-o为低频子带的标准差特征。与第2级分解相比,第1级变换之后统计的高频系数的标准差范围较小,影像较暗,能反映更多的局部细节信息。低频子带包含的信息量很小,说明大部分的纹理特征在高频子带中。小波分解得到的纹理影像显示了大部分线性特征。因研究区主要为环形地质体,东北-西南方向纹理细节较为鲜明,小波分解的水平子带体现出来的空间变异性更大。
3. 结果及分析
分别将不同窗口纹理特征采用SVM分类,分类精度(图 4)显示,随着窗口变大,分类精度先升高后降低,最终确定了7×7像素窗口为最佳移动窗口。图 5显示了光谱与各分解级数的小波纹理图像结合的分类精度,G1为光谱与第1级小波纹理叠加的分类精度,G1-2为光谱与第1级和第2级小波纹理叠加分类精度。可见光谱与单一级的小波纹理叠加的分类精度G1最高,可达79.248 1%,随着分解级数增加精度降低,但多级小波纹理叠加的效果优于单一级,G1-2精度最高为83.496 2%,因此本研究的小波纹理提取选择2级小波变换。
 图 4 不同移动窗口的小波纹理分类精度Figure 4. Wavelet texture classification accuracy of different moving windows
 图 5 各分解级数的小波纹理分类精度Figure 5. Wavelet texture classification accuracy of each decomposition series
3.2 分类结果
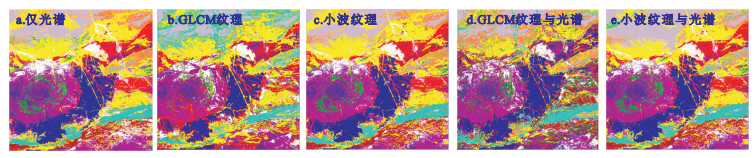
不同特征组合分类结果见图 6。仅用光谱特征分类(图 6-a)时,环形地质体分类效果较好;北部C1区、C2ηγ区及Pt2区分类较为准确;Pt1分类准确,检测出了部分方解石信息;右侧部分C2γδ错分为T2γδ;东南角T2ηγ和Pt3gn的界线不明确。仅使用GLCM纹理特征分类(图 6-b)时,Pt2和T2ξo分类效果较好;但环形地质体噪声较多,部分T2γδ错分为Q信息;部分T2ηγ错分为C2ηγ;北部C1区出现了大量错误的方解石信息;Pt1基本未识别,错分为Pt2及C1的混合结果;右侧C2ηγ与C2γδ混淆现象严重。仅采用小波纹理分类(图 6-c)时,T2ξo、Pt1及Pt2分类效果较好;北部C1中不应显示出大量方解石信息及Pt1信息;在环形地质体中间部位T2ξγ、T2γδ及T2ηγ界线不明确;东南角Pt3gn与其他岩性界线也较为模糊;右侧C2ηγ区大部分未识别,错分为T2ηγ和T2ξo。采用光谱与GLCM纹理相结合分类(图 6-d)时,C1区、C2ηγ区、Pt2区、Pt1区和T2ξo分类都较为准确,但是在右侧少量C2γδ错分为T2γδ;右上角C1区出现了错误的Pt1信息;北部有少量方解石信息也未识别出来;东南角噪声较多。光谱与小波纹理相结合的分类(图 6-e)时,各地质体界线都较为鲜明,错分现象较少;同时,C1区范围更加准确,小区域方解石信息亦有显现;东南角T2ηγ和Pt3gn的界线较明显;环形地质体几个环带较清楚,整体分类效果是最优的。
3.3 矿物提取及填图结果
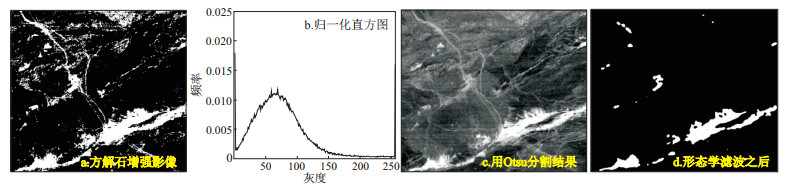
图 7为通过矿物提取指数提取的方解石信息。图 7-a为方解石信息增强影像,高亮区域为方解石出现区域,亮度越高,方解石分布越集中。图 7-b为该影像的归一化直方图,直方图无明显波谷,使用Otsu计算出的阈值为0.447 1,分割结果为图 7-c。结果中有大量孤立点及毛刺现象,对结果进行形态学腐蚀得到7-d。因其他矿物处理过程与方解石一致,此处不再赘述。图 8为提取出的6种主要及典型造岩矿物信息的叠加结果。因石英信息覆盖面积较大,会影响其他信息显示,因此未将石英信息叠加到显示结果中。根据主要及典型造岩矿物信息,结合区域已有地质资料,可对分类效果图中不同岩性单元进行初步判定。
已有地质资料表明,白云母和方解石主要出现在古元古界星星峡岩群(Pt1)、中元古界卡瓦布拉克岩群(Pt2)和下石碳世雅满苏组(C1)中,基本不出现在侵入岩中。因此,可以通过方解石和白云母区分研究区地层和侵入岩。
方解石集中分布区应为大理岩或灰岩。研究区方解石的集中区为以大理岩为主的中元古界卡瓦布拉克岩群(Pt2)。卡瓦布拉克岩群中局部呈线性分布的区域未提取出方解石信息,说明该地区应为卡瓦布拉克岩群碎屑岩分布区。方解石零星分布的区域应为古元古界星星峡岩群(Pt1)和下石炭世雅满苏组(C1)。其中,星星峡岩群大理岩成层状,提取出的方解石信息亦呈层状分布;雅满苏组以火山岩和碎屑岩为主,局部夹少量透镜状灰岩,因此,提取出的方解石信息呈团块状或零星分布。
辉石密集分布区应为中三叠世辉长岩(T2υ),辉石零星分布区应为古元古代星星峡岩群(Pt1)、中元古代卡瓦布拉克岩群(Pt2)和早石炭世雅满苏组(C1)。辉石信息与星星峡岩群和卡瓦布拉克岩群所含的大理岩有关,在星星峡岩群中呈显著的层状分布特征。雅满苏组中辉石信息与其所含的灰岩和玄武岩有关,因此,多呈团块状或零散的分布特征。结合方解石信息和辉石信息特征,可以准确区分辉长岩、星星峡岩群、卡瓦布拉克岩群和雅满苏组4个岩性单元。
角闪石信息主要分布在新元古代片麻岩(Pt3gn)、古元古代星星峡岩群(Pt1)和辉长岩(T2υ)3个地区。结合辉石和方解石信息,可以判别东南部角闪石出露区为新元古代片麻岩分布区,该岩性单元中的斜长角闪片麻岩为角闪石信息源。
前已述及,二长花岗岩、花岗闪长岩、石英正长岩和正长岩的矿物组成差异不明显,但矿物含量差异较大,这些岩性可以通过不同矿物信息分布密度进行概略判断。其中,石英分布密度最大区域应为二长花岗岩、花岗闪长岩和石英正长岩区,密度较小区为正长岩区;正长石信息在二长花岗岩、石英正长岩和正长岩区分布较密集,在花岗闪长岩区分布相对稀少;黑云母信息主要分布在正长岩和二长花岗岩区,较少出现在花岗闪长岩区,零星出现在石英正长岩区。可见,根据主要组成矿物分布密度,可以概略区分不同类型花岗岩。但是,由于不同类型花岗岩脉体穿插侵入以及风化剥蚀残积物等因素影响,根据矿物含量区分不同类型侵入岩仍然存在很多不确定因素,需要辅以野外实地检查验证。综上所述,可将各矿物提取结果叠加在分类图上,结合已有的地质资料,判定不同的填图单元,完成遥感填图(图 9)。
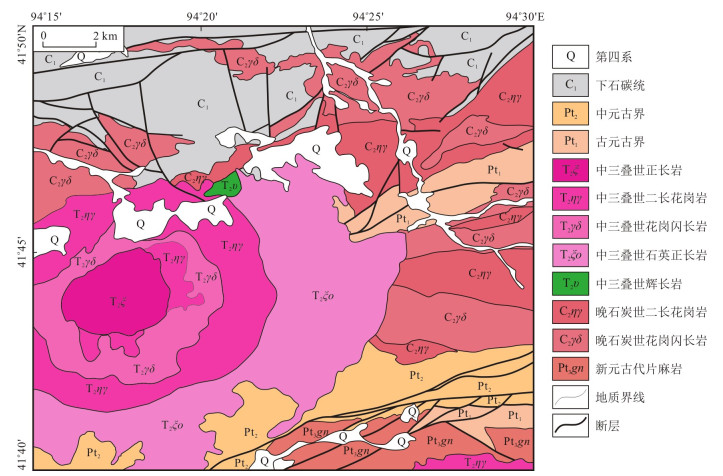
 图 9 遥感填图结果Q.第四系; C1.下石炭统; Pt2.中元古界; Pt1.下元古界; T2ξ.中三叠石正长岩; T2ηγ.中三叠世二长花岗岩; T2ξο.中三叠世石英正长岩; T2γδ .中三叠世花岗闪长岩; T2υ.中三叠世辉长岩; C2ηγ.晚石炭世二长花岗岩; C2γδ.晚石炭世花岗闪长岩; Pt3gn.新元古代片麻岩Figure 9. Remote sensing mapping results
3.4 分类精度分析
对不同特征组合的岩性分类结果进行精度评价(表 4)。仅用光谱特征分类时总体精度(OA)可达到77.177 3%,Kappa系数为0.747 7;仅用GLCM纹理及小波纹理分类时总体精度分别为61.825%及62.037 9%,Kappa系数分别为0.577 4和0.580 1。可见,基于光谱特征分类的效果优于基于纹理分类。将光谱特征分别与GLCM纹理及小波纹理组合分类的精度分别为80.820 6%和83.496 2%,Kappa系数分别为0.787 8和0.830 7。可见,组合之后的分类效果优于单独使用光谱或纹理特征。光谱特征与小波纹理组合(SF-W-TF)分类的精度比与GLCM纹理组合(SF-G-TF)的精度高2.675 6%。总体上,光谱与小波纹理特征组合更有利于区分地物,提升岩性分类效果。
表 4 不同特征的分类精度Table 4. Classification accuracy of different features分类组合 特征维数 总体精度/% Kappa系数 SF 9 77.177 3 0.747 7 G-TF 8 61.825 0 0.577 4 W-TF 8 62.037 9 0.580 1 SF-G-TF 17 80.820 6 0.787 8 SF-W-TF 17 83.496 2 0.830 7 注:SF.光谱;G-TF.GLCM纹理;W-TF.小波纹理;SF-G-TF.光谱+GLCM纹理;SF-W-TF.光谱+小波纹理;下同 基于相同样本比较SVM法与MLC法分类精度(表 5)。各种数据源采用MLC分类的精度分别为75.248 1%, 56.023 8%, 59.067 2%, 76.035 4%, 76.872 5%,Kappa系数分别为0.720 7, 0.516 1, 0.547 8, 0.735 2, 0.744 2,其中光谱与小波纹理组合的精度最高。但是,各特征组合之后采用SVM法分类的精度普遍大于MLC分类的精度。
表 5 不同分类算法的精度比较Table 5. Accuracy evaluation of different classification algorithms特征 SVM法 MLC法 OA/% Kappa系数 OA/% Kappa系数 SF 77.177 3 0.747 7 75.248 1 0.720 7 G-TF 61.825 0 0.577 4 56.023 8 0.516 1 W-TF 62.037 9 0.580 1 59.067 2 0.547 8 SF-G-TF 80.820 6 0.787 8 76.035 4 0.735 2 SF-W-TF 83.496 2 0.830 7 76.872 5 0.744 2 由于不同地质体分类结果的生产者精度(PA)及用户精度(UA)的对比(表 6)结果可知,早石炭世地层(C1)纹理及光谱特征都较为明显,各特征组合分类精度都较高,其中,光谱与小波纹理组合的PA及UA可以达到96.69%和97.17%。中元古代地层(Pt2)光谱与GLCM纹理组合时精度最高,PA及UA分别可以达到94.1%和86.03%。古元古代地层(Pt1)光谱与小波纹理结合的PA及UA可达到83.67%和81.75%。中三叠世正长岩(T2ξ)、中三叠世石英正长岩(T2ξo)采用光谱及小波纹理时精度最高,PA分别为93.43%及55.13%,UA分别为69.97%和97.19%。中三叠世二长花岗岩(T2ηγ)采用小波纹理及光谱组合时PA及UA为73.68%和71.20%。整体上,对于纹理特征鲜明的地质体,光谱与纹理结合的分类效果较好;而对于纹理不鲜明的地质体,因其具有较突出的光谱特征,则采用光谱特征分类效果好。
表 6 不同岩性的分类精度Table 6. Classification accuracy of different lithologies岩性 SF G-TF W-TF SF-G-TF SF-W-TF PA/% UA/% PA/% UA/% PA/% UA/% PA/% UA/% PA/% UA/% Q 78.01 65.92 81.95 69.04 78.86 73.07 88.46 76.86 88.98 83.84 C1 97.14 92.63 97.23 80.66 87.05 76.07 97.28 93.20 96.69 97.17 Pt2 91.73 85.91 75.43 57.42 68.91 72.56 94.10 86.03 94.93 80.88 Pt1 74.02 85.82 19.17 47.68 58.76 51.70 73.13 84.22 83.67 81.75 T2ξ 84.02 67.16 92.94 66.39 89.12 62.18 94.41 76.25 93.43 69.97 T2ηγ 66.04 63.58 62.22 54.22 70.26 50.47 73.39 63.08 73.68 71.20 T2γδ 95.42 94.81 87.53 96.05 91.71 81.41 95.30 97.10 94.84 92.37 T2ξo 52.85 76.07 43.96 80.75 54.21 73.68 51.03 73.44 55.13 97.19 T2υ 68.69 96.23 40.76 74.73 48.74 57.42 73.71 96.02 76.49 92.34 C2ηγ 58.10 78.78 38.57 37.96 8.32 26.63 60.24 80.49 63.38 92.31 C2γδ 74.74 46.91 66.55 38.31 47.91 50.60 77.7 59.71 85.89 68.14 Pt3gn 44.70 55.42 0.12 0.46 7.02 8.65 49.51 57.68 58.25 77.54 注:岩性代号说明同图 9; PA.生产者精度;UA.用户精度 3.5 讨论
本研究利用岩性自动分类,附以主要及典型造岩矿物提取结果,并结合研究区已有地质资料进行遥感填图方法研究。通过野外调查进行验证并修正遥感解译的误差。填图结果与地质图表达的图面岩性单元基本一致。此方法对植被覆盖较少地区的填图工作有很大帮助。
利用小波纹理与光谱特征相结合进行岩性分类,充分利用了高分辨率遥感影像的多尺度纹理特征,相较于仅用光谱特征分类精度提高了6.318 9%。与MLC分类相比较,SVM对地表复杂性导致的数据维度较高、非线性等问题具有突出优势。基于ASTER数据经过波段运算可准确提取辉石、石英、正长石、白云母、黑云母、方解石、角闪石等矿物。
与其他基于ASTER的填图研究相比,本研究利用波段运算、小波变换等图像处理技术,挖掘了ASTER影像的多维特征,提取出更细节的岩性信息;利用有效的机器学习算法,更精确地确定了地质体的边界;利用岩性分类和矿物提取结果综合判断填图单元,填图结果更准确;总之,该方法提高了ASTER数据在填图中的应用价值。本研究也发现了几个可改进的方向:①矿物颗粒大小显著影响矿物提取精度,可考虑将粒度指数作为约束条件提取矿物;②地质体经过长期演变具有各向异性的特征,需研究具有多分辨率与多方向性的多尺度几何分析方法提取岩性信息的效果,如NSCT、NSST等[16-17];③单一数据源探测岩石单元的空间形态和内部层理特征的效果有限,需融合不同数据源的空间和光谱优势;④仅使用遥感影像的光谱及纹理特征进行岩性分类,忽略了影像的其他背景知识,如几何外形、颜色、色调、阴影等,需进一步研究影像空间信息在遥感填图中的应用。
4. 结语
基于ASTER数据进行了岩性自动分类加矿物提取的填图方法研究。结果表明,基于ASTER的多维特征分类及矿物鉴定方法能区分地表关键岩性;利用2级小波变换提取的纹理特征与光谱特征结合的总体分类精度能达到83.496 2%,较GLCM纹理与光谱结合的分类精度提高了2.675 6%;SVM较MLC更适合岩性自动分类;ASTER数据提取黑云母、方解石、角闪石等矿物效果较好。野外验证证明,本研究填图结果与野外调查结果的相关系数为0.7,较已有地质图能更客观地显示地质体展布特征,并具有更细节的信息,填图效率及精度更高,说明本研究基于ASTER数据的结合岩性自动分类及矿物提取进行填图的方法可作为一种在植被覆盖稀少地区的有效地质研究手段。
-
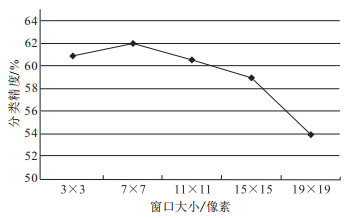
图 4 不同移动窗口的小波纹理分类精度
Figure 4. Wavelet texture classification accuracy of different moving windows
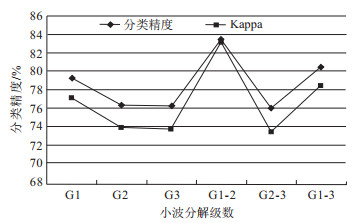
图 5 各分解级数的小波纹理分类精度
Figure 5. Wavelet texture classification accuracy of each decomposition series

图 9 遥感填图结果
Q.第四系; C1.下石炭统; Pt2.中元古界; Pt1.下元古界; T2ξ.中三叠石正长岩; T2ηγ.中三叠世二长花岗岩; T2ξο.中三叠世石英正长岩; T2γδ .中三叠世花岗闪长岩; T2υ.中三叠世辉长岩; C2ηγ.晚石炭世二长花岗岩; C2γδ.晚石炭世花岗闪长岩; Pt3gn.新元古代片麻岩
Figure 9. Remote sensing mapping results
表 1 矿物的吸收谱带与ASTER波段的对应关系
Table 1. Correspondence relation between absorption bands of minerals and ASTER bands
矿物 ASTER波段 1 2 3 4 5 6 7 8 9 10 11 12 13 14 黑云母 强吸 高反 弱反 高反 石英 强吸 高反 强吸 方解石 弱吸 强吸 高反 正长石 弱反 强吸 高反 角闪石 弱反 弱吸 强吸 强反 辉石 高反 强吸 白云母 高反 强吸 高反  下载: 导出CSV
表 2 矿物提取指数
Table 2. Extraction index of minerals
矿物 矿物提取指数 黑云母 [b12/(b11+b13)]×(b14/b11) 石英 [b11/(b10+b12)]×(b13/b12) 方解石 b14/(b13+b12) 正长石 (b12+b10)/b11 角闪石 (b6/b8)×(b12/b10) 辉石 b1/b3 白云母、绢云母 (b5+b7)/b6
下载: 导出CSV
表 3 岩性分类所用样本数
Table 3. Sample number for lithological classification
岩性 Q C1 Pt2 Pt1 T2ξ T2 ηγ T2γδ T2ξo T2υ C2ηγ C2γδ Pt3 gn 训练样本 1 706 1 737 1 469 951 1 019 1 564 1 469 316 795 1 844 3 639 770 检验样本 2 460 2 239 2 625 2 248 1 020 1 755 2 191 1 724 439 2 007 1 148 812 注:岩性同图 1
下载: 导出CSV
表 4 不同特征的分类精度
Table 4. Classification accuracy of different features
分类组合 特征维数 总体精度/% Kappa系数 SF 9 77.177 3 0.747 7 G-TF 8 61.825 0 0.577 4 W-TF 8 62.037 9 0.580 1 SF-G-TF 17 80.820 6 0.787 8 SF-W-TF 17 83.496 2 0.830 7 注:SF.光谱;G-TF.GLCM纹理;W-TF.小波纹理;SF-G-TF.光谱+GLCM纹理;SF-W-TF.光谱+小波纹理;下同
下载: 导出CSV
表 5 不同分类算法的精度比较
Table 5. Accuracy evaluation of different classification algorithms
特征 SVM法 MLC法 OA/% Kappa系数 OA/% Kappa系数 SF 77.177 3 0.747 7 75.248 1 0.720 7 G-TF 61.825 0 0.577 4 56.023 8 0.516 1 W-TF 62.037 9 0.580 1 59.067 2 0.547 8 SF-G-TF 80.820 6 0.787 8 76.035 4 0.735 2 SF-W-TF 83.496 2 0.830 7 76.872 5 0.744 2
下载: 导出CSV
表 6 不同岩性的分类精度
Table 6. Classification accuracy of different lithologies
岩性 SF G-TF W-TF SF-G-TF SF-W-TF PA/% UA/% PA/% UA/% PA/% UA/% PA/% UA/% PA/% UA/% Q 78.01 65.92 81.95 69.04 78.86 73.07 88.46 76.86 88.98 83.84 C1 97.14 92.63 97.23 80.66 87.05 76.07 97.28 93.20 96.69 97.17 Pt2 91.73 85.91 75.43 57.42 68.91 72.56 94.10 86.03 94.93 80.88 Pt1 74.02 85.82 19.17 47.68 58.76 51.70 73.13 84.22 83.67 81.75 T2ξ 84.02 67.16 92.94 66.39 89.12 62.18 94.41 76.25 93.43 69.97 T2ηγ 66.04 63.58 62.22 54.22 70.26 50.47 73.39 63.08 73.68 71.20 T2γδ 95.42 94.81 87.53 96.05 91.71 81.41 95.30 97.10 94.84 92.37 T2ξo 52.85 76.07 43.96 80.75 54.21 73.68 51.03 73.44 55.13 97.19 T2υ 68.69 96.23 40.76 74.73 48.74 57.42 73.71 96.02 76.49 92.34 C2ηγ 58.10 78.78 38.57 37.96 8.32 26.63 60.24 80.49 63.38 92.31 C2γδ 74.74 46.91 66.55 38.31 47.91 50.60 77.7 59.71 85.89 68.14 Pt3gn 44.70 55.42 0.12 0.46 7.02 8.65 49.51 57.68 58.25 77.54 注:岩性代号说明同图 9; PA.生产者精度;UA.用户精度
下载: 导出CSV
-
[1] Hosseinjani Z M, Tangestani M H, Roldan F V, et al. Sub-pixel mineral mapping of a porphyry copper belt using EO-1 hyperion data[J]. Advances in Space Research, 2014, 53(3): 440-451. doi: 10.1016/j.asr.2013.11.029 [2] Hisham G, Habes G. Detection of gossan zones in Aridregions using Landsat 8 OLI data: Implication for mineral exploration in the eastern Arabian shield, Saudi Arabia[J]. Natural Resources Research, 2018, 27(1): 109-124. doi: 10.1007/s11053-017-9341-8 [3] 崔静月, 董玉森, 岳文丽, 等. 基于遥感蚀变信息提取巴林格撞击坑周边铁陨石[J]. 地质科技通报, 2021, 40(1): 209-216. https://www.cnki.com.cn/Article/CJFDTOTAL-DZKQ202101023.htmCui J Y, Dong Y S, Yue W L, et al. Extraction of iron meteorites from the Barringer Meteor Crater based on remote sensing alteration information[J]. Bulletin of Geological Science and Technology, 2021, 40(1): 209-216(in Chinese with English abstract). https://www.cnki.com.cn/Article/CJFDTOTAL-DZKQ202101023.htm [4] 王俊虎, 武鼎, 张杰林, 等. 基于多源遥感数据的纳米比亚欢乐谷地区千岁兰断裂带识别及新发现[J]. 地质科技通报, 2020, 39(5): 183-190. https://www.cnki.com.cn/Article/CJFDTOTAL-DZKQ202005023.htmWang J H, Wu D, Zhang J L, et al. Identification and new discovery of Qiansxuilan fault belt in Gaudeanmus area, Namibia based in the multi-source remote sensing data[J]. Bulletin of Geological Science and Technology, 2020, 39(5): 183-190(in Chinese with English abstract). https://www.cnki.com.cn/Article/CJFDTOTAL-DZKQ202005023.htm [5] Wang R, Lin J Y, Zhao B, et al. Integrated approach for lithological classification using ASTER imagery in a shallowly covered region: The eastern Yanshan Mountain of China[J]. IEEE Journal of Selected Topics in Applied Earth Observations and Remote Sensing, 2018, 11(12): 4791-4807. doi: 10.1109/JSTARS.2018.2879493 [6] Aboelkair H, Ninomiya Y, Watanabe Y, et al. Processing and interpretation of ASTER TIR data for mapping of rare-metal-enrichedalbite granitoids in the Central Eastern Desert of Egypt[J]. Journal of African Earth Sciences, 2010, 58(1): 141-151. doi: 10.1016/j.jafrearsci.2010.01.007 [7] He J, Harris J R, Sawada M, et al. Comparison of classification algorithms using Landsat-7 and Landsat-8 data for mapping lithology in Canada′s Arctic[J]. International Journal of Remote Sensing, 2015, 36(8): 2252-2276. doi: 10.1080/01431161.2015.1035410 [8] Du P J, Tan K, Xing X S. A novel binary tree support vector machine for hyperspectral remote sensing image classification[J]. Optics Communications, 2012, 285: 3054-3060. doi: 10.1016/j.optcom.2012.02.092 [9] Mryka H B. Practical guidelines for choosing GLCM textures to use in landscape classification tasks over a range of moderate spatial scales[J]. International Journal of Remote Sensing, 2017, 38: 1312-1338. doi: 10.1080/01431161.2016.1278314 [10] Seyedmohammadi J, Navidi M N, Esmaeelnejad L. Geospatial modeling of surface soil texture of agricultural land using fuzzy logic, geostatistics and GIS techniques[J]. Communications in Soil Science and Plant Analysis, 2019, 50(12): 1452-1464. doi: 10.1080/00103624.2019.1626870 [11] Li Q Y, Huang X, Wen D W, et al. Integrating multiple textural features for remote sensing image change detection[J]. Photogrammetric Engineering and Remote Sensing, 2017, 83(2): 109-121. doi: 10.14358/PERS.83.2.109 [12] Mars J C, Rowan L C. ASTER spectral analysis and lithologic mapping of the Khanneshin carbonatite volcano, Afghanistan[J]. Geosphere, 2011, 7(1): 276-289. doi: 10.1130/GES00630.1 [13] Ye M, Routsos D. Wavelet-based color texture retrieval using the independent component color space[J]. IEEE International Conference Image Processing, 2008, 15: 165-168. [14] Regniers O, Bombrun L, Guyon D, et al. Wavelet-based texture features for the classification of age classes in a maritime pine forest[J]. IEEE Geoscience and Remote Sensing Letters, 2015, 12(3): 621-625. doi: 10.1109/LGRS.2014.2353656 [15] Wan S A, Chang S S. Crop classification with World View-2 imagery using Support Vector Machine comparing texture analysis approaches and grey relational analysis in Jianan Plain, Taiwan[J]. International Journal of Remote Sensing, 2018, 40(21): 8076-8092. [16] Ma D, Lai H C. Remote sensing image matching based improved ORB in NSCT domain[J]. Journal of The Indian Society of Remote Sensing, 2019, 47(5): 801-807. doi: 10.1007/s12524-019-00958-y [17] Moonon A U, Hu J W, Li S T. Remote sensing image fusion method based on nonsubsampled shearlet transform and sparse representation[J]. Sensing and Imaging, 2015, 16(1): 18-23. 期刊类型引用(3)
1. 刘洪成,叶发旺,韩晓青,谭宏婕,鲁纳川,张川. 无人机高光谱岩性和矿物识别技术研究. 世界核地质科学. 2024(03): 560-572 .  百度学术
百度学术2. 张兵,祁雪梅,黄亚平,张海锋,皇范蕤. 基于地震纹理属性的深部煤层气储层裂缝预测方法研究(英文). Applied Geophysics. 2024(04): 794-804+881 . 百度学术3. 陶从咏,郭晓宁,于玉帅,许笑玮,张世晖,周文孝,骆满生,朱云海,徐亚东. 基于通道注意力机制的智能地质填图. 工程地球物理学报. 2023(03): 427-436 . 百度学术其他类型引用(1)
-


 下载:
下载:


 下载:
下载:

 百度学术
百度学术
 点击查看大图
计量
- 文章访问数: 759
- PDF下载量: 52
- 被引次数: 4

