


Study on coal origin traceability technology based on infrared spectrum
-
摘要:
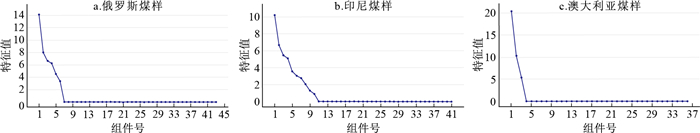
随着我国煤炭对外依赖程度的不断提高, 煤炭进口掺假、以次充好的问题日益严重, 因此建立准确、快速、便捷、安全、环保的煤炭产地溯源技术的工作势在必行。红外光谱分析技术近年来也已经广泛应用在医药、食品、工业等领域的原产地鉴别工作中。红外光谱中包含丰富的成分与结构信息, 不同国家产出的煤炭, 不同产地的煤炭在组分及分子结构上存在较大的差异, 可以作为产地溯源的特征指示信息。因此, 本研究应用傅里叶红外光谱分析仪对来自5个国家30个进口煤炭样品进行了光谱采集分析, 通过不同产地的煤炭在红外光谱上所表现出的特征性, 以主成分分析和判别分析等化学计量学分析方法创新性地建立了3个国家的基于红外光谱特征信息的煤炭产地溯源模型, 并对模型的准确性进行了验证, 得出的主要认识如下: ①不同国家产出的煤炭, 其测定的红外光谱曲线形状存在差异, 所含有的官能团种类不同, 同种官能团吸收峰的数量、峰位及峰强度也有明显的差异; ②基于3个国家23个煤炭样品的红外光谱测试数据, 建立了官能团的特征信息数据库, 对其进行主成分分析和判别分析等化学计量学方法分析, 建立了俄罗斯、印尼和澳大利亚的煤炭产地溯源模型; ③选取已知产地的煤炭样本对建立的产地溯源模型的准确性进行了验证, 溯源效果准确率达到100%。某一产地的样本量越多, 模型判别分类的准确率更高, 溯源效果也更好。
Abstract:With the increasing dependence of China's coal on the outside world, the problem of coal import adulteration and coal filling is becoming increasingly serious, so it is imperative to establish the accurate, fast, convenient, safe, and environmentally friendly technology of coal origin tracing. In recent years, infrared spectroscopy has been widely used in the field of origin identification in medicine, food, industry and so on. The infrared spectrum contains abundant informationon composition and structure, and the differencesin composition and molecular structure of coals among different countries and regions can be used as the characteristic indications of source tracing. Therefore, in this paper, 30 imported coal samples from 5 countries were collected and analyzed by Fourier Transform Infrared (FTIR) spectrometry, and the characteristics of coal samples from different producing areas were analyzed using principal component analysis, discriminant analysis, and other chemometrics methods.A coal source tracing model based on infrared spectral characteristic information in three countries was established, and its accuracy was verified. The main conclusions are as follows: ①There are differences in the shapes of infrared spectra curves and the types of functional groups in coals from different countries, and the number, position, and intensity of the absorption peaks of the same functional group were also different. ②Based on the infrared spectra data of 23 coal samples from 3 countries, the characteristic information database of functional groups was established, and the principal component analysis and discriminant analysis were carried out for the chemometrics analysis. The traceability models of coal origin in Russia, Indonesia, and Australia were established. ③The accuracy of the origin tracing model is verified by coal samples from known origins, and the accuracy of the result is 100%. The more samples there are, the higher the accuracy and the better the traceability effect of the model.
-

图 3 不同国家样本的典则判别函数的散点图
国别1.俄罗斯;国别2.澳大利亚;国别3.印尼;下同
Figure 3. Scatter plots of canonical discriminant function of samples from different countries

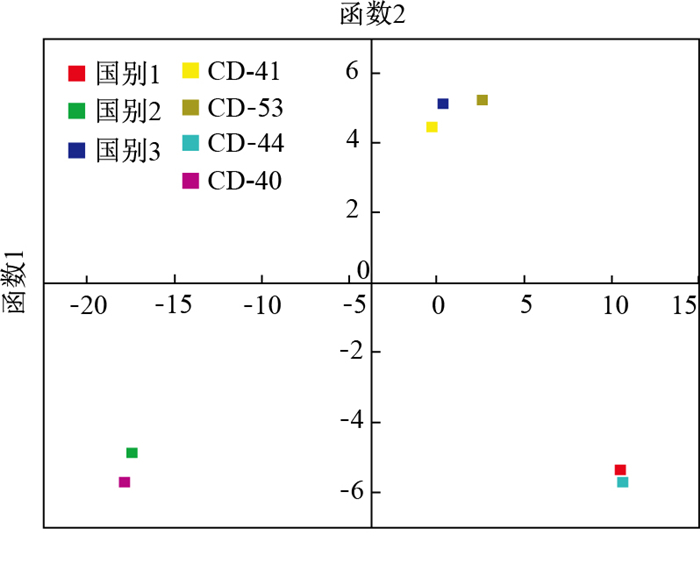
图 4 不同国家组质心和待检测样本的函数坐标散点图
Figure 4. Functional coordinatescatter plots ofcentroids and samples to be tested of different countries
表 1 进口煤炭样品及其基本煤质特征
Table 1. Imported coal samples and their basic coal quality characteristics
煤样 国别 给定品名 镜质体反射率/Ro/% 灰分Ad 水分Mad 挥发分Vdaf wB/% c1 俄罗斯Vanino 烟煤 0.533 31.88 3.49 46.85 c2 俄罗斯Shakhtersk 动力煤 0.341 17.53 13.83 48.61 c3 澳大利亚Newcastle 烟煤 0.707 19.58 5.48 36.73 c4 印尼adangbay 烟煤 0.394 4.83 33.81 52.36 c5 印尼Asam Asam 褐煤 0.213 6.78 33.99 54.14 c7 印尼Balikpapan 褐煤 0.220 7.01 33.16 47.94 c9 印尼Bunati 褐煤 0.281 5.23 32.72 52.44 c10 印尼Kaltorang 褐煤 0.261 3.04 31.76 50.55 c16 印尼Muara Berau 其他煤 0.453 5.43 9.84 40.64 c39 俄罗斯新西伯利亚新库兹涅茨克欧亚斯煤矿 其他烟煤 0.775 22.15 5.25 38.96 c40 澳大利亚adelaide 其他烟煤 0.598 20.84 11.07 32.58 c41 澳大利亚Balmain 其他煤 0.342 7.96 23.36 47.84 c42 印尼belawan 其他煤 0.338 22.80 12.81 35.61 c44 澳大利亚bell bay 其他烟煤 0.829 9.36 4.96 34.04 c45 俄罗斯kuzbass 其他烟煤 0.651 11.70 6.26 40.86 c46 俄罗斯maly russia 其他烟煤 0.359 2.38 25.07 50.33 c47 印尼PT adaro Indonesia 褐煤 0.267 4.54 31.13 51.79 c49 印尼PT bara tabang 其他煤 0.323 7.57 24.12 48.75 c51 印尼PT bukit asaml(perserd)tbk 其他煤 0.394 6.08 24.29 46.03 c53 印尼PT mandiri intiperkasa 褐煤 0.301 9.78 34.11 53.49 c54 印尼PT timuraya tunggal 褐煤 0.279 7.18 33.23 54.05 c56 印尼PT tunas inti abadi 褐煤 0.313 7.63 28.54 53.14 c57 印尼PT baba anugrah sejahtera 其他煤 0.395 6.43 20.49 47.15 c58 印尼PT berau coal 其他烟煤 0.636 12.36 6.22 41.01 c59 俄罗斯rgakka 褐煤 0.317 7.89 29.32 43.98 c60 菲律宾semirara mining and power corporation 其他煤 0.353 5.73 28.52 46.39 c61 马来西亚sibuti 其他烟煤 0.833 10.16 4.76 30.52 c62 俄罗斯south kuzbass 其他煤 0.256 35.54 26.81 69.32 c63 菲律宾subac nipa 其他烟煤 0.450 13.85 15.30 47.87 c64 俄罗斯vladivostok 其他烟煤 0.738 23.59 5.01 35.29  下载: 导出CSV
表 2 俄罗斯煤样主成分提取结果
Table 2. Principal component extraction results of Russian coal samples
成分 初始特征值 成分 初始特征值 特征值 方差百分比/% 累积方差/% 特征值 方差百分比/% 累积方差/% 1 14.133 32.867 32.867 23 8.25×10⁻¹⁷ 1.92×10⁻¹⁶ 100 2 8.036 18.687 51.555 24 7.15×10⁻¹⁷ 1.66×10⁻¹⁶ 100 3 6.674 15.52 67.075 25 -3.76×10⁻¹⁹ -8.75×10⁻¹⁹ 100 4 6.266 14.573 81.647 26 -6.73×10⁻¹⁷ -1.57×10⁻¹⁶ 100 5 4.539 10.557 92.204 27 -8.10×10⁻¹⁷ -1.88×10⁻¹⁶ 100 6 3.352 7.796 100 28 -1.11×10⁻¹⁶ -2.58×10⁻¹⁶ 100 7 1.76×10⁻¹⁵ 4.09×10⁻¹⁵ 100 29 -2.15×10⁻¹⁶ -5.01×10⁻¹⁶ 100 8 1.11×10⁻¹⁵ 2.59×10⁻¹⁵ 100 30 -2.41×10⁻¹⁶ -5.59×10⁻¹⁶ 100 9 9.99×10⁻¹⁶ 2.32×10⁻¹⁵ 100 31 -3.09×10⁻¹⁶ -7.19×10⁻¹⁶ 100 10 8.88×10⁻¹⁶ 2.07×10⁻¹⁵ 100 32 -3.41×10⁻¹⁶ -7.93×10⁻¹⁶ 100 11 7.77×10⁻¹⁶ 1.81×10⁻¹⁵ 100 33 -3.84×10⁻¹⁶ -8.93×10⁻¹⁶ 100 12 6.50×10⁻¹⁶ 1.51×10⁻¹⁵ 100 34 -4.73×10⁻¹⁶ -1.10×10⁻¹⁵ 100 13 6.19×10⁻¹⁶ 1.44×10⁻¹⁵ 100 35 -5.65×10⁻¹⁶ -1.32×10⁻¹⁵ 100 14 5.57×10⁻¹⁶ 1.29×10⁻¹⁵ 100 36 -5.81×10⁻¹⁶ -1.35×10⁻¹⁵ 100 15 4.98×10⁻¹⁶ 1.16×10⁻¹⁵ 100 37 -6.21×10⁻¹⁶ -1.44×10⁻¹⁵ 100 16 4.73×10⁻¹⁶ 1.10×10⁻¹⁵ 100 38 -6.38×10⁻¹⁶ -1.49×10⁻¹⁵ 100 17 3.57×10⁻¹⁶ 8.31×10⁻¹⁶ 100 39 -8.56×10⁻¹⁶ -1.99×10⁻¹⁵ 100 18 3.51×10⁻¹⁶ 8.17×10⁻¹⁶ 100 40 -1.08×10⁻¹⁵ -2.51×10⁻¹⁵ 100 19 2.74×10⁻¹⁶ 6.38×10⁻¹⁶ 100 41 -1.18×10⁻¹⁵ -2.75×10⁻¹⁵ 100 20 2.55×10⁻¹⁶ 5.94×10⁻¹⁶ 100 42 -1.98×10⁻¹⁵ -4.61×10⁻¹⁵ 100 21 1.96×10⁻¹⁶ 4.56×10⁻¹⁶ 100 43 -2.87×10⁻¹⁵ -6.68×10⁻¹⁵ 100 22 1.23×10⁻¹⁶ 2.87×10⁻¹⁶ 100
下载: 导出CSV
表 3 印尼煤样主成分提取结果
Table 3. Principal component extraction results of Indonesian coal samples
成分 初始特征值 成分 初始特征值 特征值 方差百分比/% 累积方差/% 特征值 方差百分比/% 累积方差/% 1 10.199 24.876 24.876 22 2.46×10⁻¹⁶ 5.99×10⁻¹⁶ 100 2 6.657 16.237 41.113 23 2.15×10⁻¹⁶ 5.24×10⁻¹⁶ 100 3 5.477 13.358 54.471 24 1.59×10⁻¹⁶ 3.88×10⁻¹⁶ 100 4 5.094 12.424 66.894 25 1.28×10⁻¹⁶ 3.12×10⁻¹⁶ 100 5 3.563 8.691 75.585 26 -3.60×10⁻¹⁸ -8.78×10⁻¹⁸ 100 6 3.034 7.399 82.984 27 -4.54×10⁻¹⁷ -1.11×10⁻¹⁶ 100 7 2.759 6.730 89.715 28 -1.04×10⁻¹⁶ -2.53×10⁻¹⁶ 100 8 2.043 4.982 94.697 29 -1.35×10⁻¹⁶ -3.29×10⁻¹⁶ 100 9 1.287 3.140 97.837 30 -1.95×10⁻¹⁶ -4.76×10⁻¹⁶ 100 10 0.887 2.163 100 31 -2.68×10⁻¹⁶ -6.54×10⁻¹⁶ 100 11 1.34×10⁻¹⁵ 3.26×10⁻¹⁵ 100 32 -2.72×10⁻¹⁶ -6.64×10⁻¹⁶ 100 12 1.19×10⁻¹⁵ 2.91×10⁻¹⁵ 100 33 -3.84×10⁻¹⁶ -9.36×10⁻¹⁶ 100 13 1.03×10⁻¹⁵ 2.52×10⁻¹⁵ 100 34 -4.29×10⁻¹⁶ -1.05×10⁻¹⁵ 100 14 8.18×10⁻¹⁶ 1.99×10⁻¹⁵ 100 35 -4.75×10⁻¹⁶ -1.16×10⁻¹⁵ 100 15 7.15×10⁻¹⁶ 1.74×10⁻¹⁵ 100 36 -5.19×10⁻¹⁶ -1.27×10⁻¹⁵ 100 16 6.65×10⁻¹⁶ 1.62×10⁻¹⁵ 100 37 -7.33×10⁻¹⁶ -1.79×10⁻¹⁵ 100 17 6.49×10⁻¹⁶ 1.58×10⁻¹⁵ 100 38 -9.16×10⁻¹⁶ -2.23×10⁻¹⁵ 100 18 5.87×10⁻¹⁶ 1.43×10⁻¹⁵ 100 39 -1.04×10⁻¹⁵ -2.55×10⁻¹⁵ 100 19 4.93×10⁻¹⁶ 1.20×10⁻¹⁵ 100 40 -1.62×10⁻¹⁵ -3.96×10⁻¹⁵ 100 20 3.83×10⁻¹⁶ 9.35×10⁻¹⁶ 100 41 -2.36×10⁻¹⁵ -5.76×10⁻¹⁵ 100 21 3.28×10⁻¹⁶ 8.00×10⁻¹⁶ 100
下载: 导出CSV
表 4 澳大利亚煤样主成分提取结果
Table 4. Principal component extraction results of Australian coal samples
成分 初始特征值 成分 初始特征值 特征值 方差百分比/% 累积方差/% 特征值 方差百分比/% 累积方差/% 1 20.332 56.479 56.479 19 8.40×10⁻¹⁷ 2.33×10⁻¹⁶ 100 2 10.294 28.596 85.074 20 3.14×10⁻¹⁸ 8.72×10⁻¹⁸ 100 3 5.373 14.926 100 21 -5.81×10⁻¹⁷ -1.61×10⁻¹⁶ 100 4 4.84×10⁻¹⁵ 1.34×10⁻¹⁴ 100 22 -1.13×10⁻¹⁶ -3.14×10⁻¹⁶ 100 5 3.05×10⁻¹⁵ 8.46×10⁻¹⁵ 100 23 -1.24×10⁻¹⁶ -3.45×10⁻¹⁶ 100 6 1.32×10⁻¹⁵ 3.67×10⁻¹⁵ 100 24 -1.72×10⁻¹⁶ -4.77×10⁻¹⁶ 100 7 1.19×10⁻¹⁵ 3.30×10⁻¹⁵ 100 25 -2.19×10⁻¹⁶ -6.08×10⁻¹⁶ 100 8 8.39×10⁻¹⁶ 2.33×10⁻¹⁵ 100 26 -2.23×10⁻¹⁶ -6.20×10⁻¹⁶ 100 9 6.56×10⁻¹⁶ 1.82×10⁻¹⁵ 100 27 -2.76×10⁻¹⁶ -7.66×10⁻¹⁶ 100 10 5.62×10⁻¹⁶ 1.56×10⁻¹⁵ 100 28 -4.01×10⁻¹⁶ -1.11×10⁻¹⁵ 100 11 5.22×10⁻¹⁶ 1.45×10⁻¹⁵ 100 29 -4.31×10⁻¹⁶ -1.20×10⁻¹⁵ 100 12 4.82×10⁻¹⁶ 1.34×10⁻¹⁵ 100 30 -5.15×10⁻¹⁶ -1.43×10⁻¹⁵ 100 13 3.94×10⁻¹⁶ 1.09×10⁻¹⁵ 100 31 -6.00×10⁻¹⁶ -1.67×10⁻¹⁵ 100 14 3.70×10⁻¹⁶ 1.03×10⁻¹⁵ 100 32 -6.01×10⁻¹⁶ -1.67×10⁻¹⁵ 100 15 3.34×10⁻¹⁶ 9.27×10⁻¹⁶ 100 33 -8.12×10⁻¹⁶ -2.26×10⁻¹⁵ 100 16 2.57×10⁻¹⁶ 7.15×10⁻¹⁶ 100 34 -1.16×10⁻¹⁵ -3.22×10⁻¹⁵ 100 17 2.06×10⁻¹⁶ 5.71×10⁻¹⁶ 100 35 -1.39×10⁻¹⁵ -3.85×10⁻¹⁵ 100 18 1.20×10⁻¹⁶ 3.32×10⁻¹⁶ 100 36 -3.05×10⁻¹⁵ -8.46×10⁻¹⁵ 100
下载: 导出CSV
表 5 不同国家的典则判别函数系数
Table 5. Coefficient of canonical discriminant function in different countries
函数系数 函数系数 1 2 1 2 芳烃CH链2 0.001 0.012 C-O链1 0.010 0.002 氢键结合的醇 2.708 -1.069 C-O链2 -0.007 -0.004 自由缔合的羟基 -9.290 3.126 羟基苯和醚的C-O伸缩振动 0 0.004 酚、醇的OH 1 1.443 -0.542 C-O链3 0.032 -0.012 CH链2 0 0.007 C-O链4 0.008 -0.004 对称CH2伸缩振动 3.870 -5.548 -CH2和-CH3的对称弯曲振动 -0.635 -0.252 对称RCH3伸缩振动 -0.006 0.007 -CH2和CH3链2 0.286 0.110 非对称CH2伸缩振动 6.989 -1.928 芳烃CH 3 -0.014 0.006 CH3的伸缩振动 0.666 2.709 氢键缔合的羰基,-O-取代C=C 1.390 -1.330 烷烃中甲基(CH3),运动状态为摇摆振动 -15.210 -0.339 羰基 0.111 1.697 CH3链1 1.560 0.121 CH2组成的长链1 -0.013 0.016 (常量) -3 291.590 7 693.168 CH2组成的长链2 0.010 -0.001
下载: 导出CSV
表 6 组质心处的函数值
Table 6. Function value table at group centroid
组质心处的函数 国别 函数系数 1 2 1 10.442 -5.341 2 -17.517 -4.856 3 0.312 5.155 注:按组平均值进行求值的未标准化典则判别函数
下载: 导出CSV
表 7 煤样溯源效果验证表
Table 7. Verification table of coal sample traceability effect
样本编号 国别 Dis_2 Dis1_3 Dis2_3 Dis1_4 Dis2_4 Dis3_4 CD-44 1 1 10.587 5 -5.688 94 1 0 0 CD-40 2 2 -17.913 51 -5.685 06 0 1 0 CD-41 3 3 -0.335 26 4.479 13 0 0 1 CD-53 3 3 2.548 55 5.245 75 0 0 1
下载: 导出CSV
-
[1] 兰君. 中国煤炭产业转型升级与空间布局优化研究[D]. 北京: 中国地质大学(北京), 2019.Lan J. Research on the transformation and upgrading of China's coal industry and spatial layout optimization[D]. Beijing: China University of Geosciences (Beijing), 2019(in Chinese with English abstract). [2] 罗陨飞, 姜英, 涂华. 我国煤炭进口形势与进口煤质量分析与研究[J]. 煤质技术, 2011, 26(2): 1-5. doi: 10.3969/j.issn.1007-7677.2011.02.001Luo Y F, Jiang Y, Tu H. Analysis and research on China's coal import situation and imported coal quality[J]. Coal Quality Technology, 2011, 26(2): 1-5(in Chinese with English abstract). doi: 10.3969/j.issn.1007-7677.2011.02.001 [3] 马俊华. 2013煤炭博弈谁是赢家[J]. 现代工业经济和信息化, 2014, 4(1): 66-67. doi: 10.3969/j.issn.2095-0748.2014.01.030Ma J H. Who is the winner in the coal game in 2013[J]. Modern Industrial Economy and Informatization, 2014, 4(1): 66-67(in Chinese with English abstract). doi: 10.3969/j.issn.2095-0748.2014.01.030 [4] 陈启昕, 叶海峰. 2015年福建省进口煤炭质量状况分析[J]. 能源与环境, 2016, 20(5): 17-22. doi: 10.3969/j.issn.1672-9064.2016.05.008Chen Q X, Ye H F. Quality analysis of imported coal in Fujian Province in 2015[J]. Energy and Environment, 2016, 20(5): 17-22(in Chinese with English abstract). doi: 10.3969/j.issn.1672-9064.2016.05.008 [5] 郭振华, 陈换美. 食品溯源技术研究现状及分析[J]. 新疆农机化, 2017, 21(6): 34-37. https://www.cnki.com.cn/Article/CJFDTOTAL-XJNJ201706015.htmGuo Z H, Chen H M. Research status and analysis of food traceability technology[J]. Xinjiang Agricultural Mechanization, 2017, 21(6): 34-37(in Chinese with English abstract). https://www.cnki.com.cn/Article/CJFDTOTAL-XJNJ201706015.htm [6] 马慧鋆, 余冰雪, 李妍, 等. 食品溯源技术研究进展[J]. 食品与发酵工业, 2017, 43(5): 277-284. https://www.cnki.com.cn/Article/CJFDTOTAL-SPFX201705044.htmMa H Y, Yu B X, Li Y, et al. Research progress of food traceability technology[J]. Food and Fermentation Industry, 2017, 43 (5): 277-284(in Chinese with English abstract). https://www.cnki.com.cn/Article/CJFDTOTAL-SPFX201705044.htm [7] 谭莉, 李汴生. 农产品与加工食品产地溯源技术研究进展[J]. 农产品加工: 学刊, 2014, 18(15): 81-85. https://www.cnki.com.cn/Article/CJFDTOTAL-NCJX201415029.htmTan L, Li B S. Research progress on Origin Traceability Technology of agricultural products and processed food[J]. Agricultural Products Processing: Academic Journal, 2014, 18(15): 81-85(in Chinese with English abstract). https://www.cnki.com.cn/Article/CJFDTOTAL-NCJX201415029.htm [8] 袁玉伟, 胡桂仙, 邵圣枝, 等. 茶叶产地溯源与鉴别检测技术研究进展[J]. 核农学报, 2013, 27(4): 452-457. https://www.cnki.com.cn/Article/CJFDTOTAL-HNXB201304009.htmYuan Y W, Hu G X, Shao S Z, et al. Research progress of tea origin traceability and identification and detection technology[J]. Journal of Nuclear Agriculture, 2013, 27(4): 452-457(in Chinese with English abstract). https://www.cnki.com.cn/Article/CJFDTOTAL-HNXB201304009.htm [9] 周广军, 金志刚, 林雪. 食品溯源系统主要技术浅析[J]. 轻工标准与质量, 2018, 38(3): 20-21. https://www.cnki.com.cn/Article/CJFDTOTAL-QGBZ201803015.htmZhou G J, Jin Z G, Lin X. Analysis on main technologies of food traceability system[J]. Light Industry Standard and Quality, 2018, 38(3): 20-21(in Chinese with English abstract). https://www.cnki.com.cn/Article/CJFDTOTAL-QGBZ201803015.htm [10] 赵海燕. 小麦产地矿物元素指纹信息特征研究[D]. 北京: 中国农业科学院, 2013.Zhao H Y. Study on fingerprint information characteristics of mineral elements in wheat producing areas[D]. Beijing: Chinese Academy of Agricultural Sciences, 2013(in Chinese with English abstract). [11] 钱丽丽, 于果, 迟晓星, 等. 农产品产地溯源技术研究进展[J]. 食品工业, 2018, 39(1): 246-249. https://www.cnki.com.cn/Article/CJFDTOTAL-SPGY201801065.htmQian L L, Yu G, Chi X X, et al. Research progress on origin traceability technology of agricultural products[J]. Food Industry, 2018, 39(1): 246-249(in Chinese with English abstract). https://www.cnki.com.cn/Article/CJFDTOTAL-SPGY201801065.htm [12] Chen H, Tan C, Lin Z. Identification of ginseng according to geographical origin by near-infraredtroscopy and pattern recognition[J]. Vib. Spectrosc, 2020, 110: 103149. doi: 10.1016/j.vibspec.2020.103149 [13] Li B X, Wei Y H, Duan H G, et al. Discrimination of the geographical origin of Codonopsis pilosulausingnear infrared diffuse reflection spectroscopy coupled with random forests and k-nearest neighbor methods[J]. Vib. Spectrosc, 2012, 62: 17-22. doi: 10.1016/j.vibspec.2012.05.001 [14] Duan X J, Zhang D L, Nie L, et al. Rapid discrimination of geographical origin and evaluation of antioxidant activity of Salvia miltiorrhiza var alba by Fourier transform near infrared spectroscopy[J]. Spectroc. Acta Pt. A-Molec. Biomolec. Spectr., 2014, 122: 751-757. doi: 10.1016/j.saa.2013.12.003 [15] Liu L, Zuo Z T, Wang Y Z, et al. A fast multi-source information fusion strategy based on FTIR spectroscopy for geographical authentication of wild Gentiana rigescens[J]. Microchemical Journal, 2020, 159: 105360. doi: 10.1016/j.microc.2020.105360 [16] Kwon Y K, Jie E Y, Sartie A, et al. Rapid metabolic discrimination and prediction of dioscin content from African yam tubers using Fourier transform-infrared spectroscopy combined with multivariate analysis[J]. Food Chem., 2015, 166: 389-396. doi: 10.1016/j.foodchem.2014.06.035 [17] Wu X M, Zhang Q Z, Wang Y Z. Traceability the provenience of cultivated Paris polyphylla Smith var. yunnanensis using ATR-FTIRspectroscopy combined with chemometrics[J]. Spectroc. ActaPt. A-Molec. Biomolec. Spectr., 2019, 212: 132-145. doi: 10.1016/j.saa.2019.01.008 [18] 李明, 陈凡, 雷萌, 等. 基于LVQ与SVM算法的近红外光谱煤产地鉴别[J]. 光谱学与光谱分析, 2016, 36(9): 2793-2797. https://www.cnki.com.cn/Article/CJFDTOTAL-GUAN201609017.htmLi M, Chen F, Lei M, et al. Identification of coal producing areas by near infrared spectroscopy based on LVQ and SVM algorithm[J]. Spectroscopy and Spectral Analysis, 2016, 36 (9): 2793-2797(in Chinese with English abstract). https://www.cnki.com.cn/Article/CJFDTOTAL-GUAN201609017.htm [19] 李霞, 曾凡桂, 王威, 等. 低中煤级煤结构演化的FTIR表征[J]. 煤炭学报, 2015, 40(12): 2900-2908. https://www.cnki.com.cn/Article/CJFDTOTAL-MTXB201512021.htmLi X, Zeng F G, Wang W, et al. FTIR characterization of structural evolution of low and medium coal grade[J]. Journal of China Coal Society, 2015, 40(12): 2900-2908(in Chinese with English abstract). https://www.cnki.com.cn/Article/CJFDTOTAL-MTXB201512021.htm [20] 张科, 姚素平, 胡文瑄, 等. 煤红外光谱的精细解析及其煤化作用机制[J]. 煤田地质与勘探, 2009, 37(6): 8-13. doi: 10.3969/j.issn.1001-1986.2009.06.003Zhang K, Yao S P, Hu W X, et al. Fine resolution of infrared spectrum of coal and its mechanism of coalification[J]. Coalfield Geology and Exploration, 2009, 37 (6): 8-13(in Chinese with English abstract). doi: 10.3969/j.issn.1001-1986.2009.06.003 [21] 刘阳, 王光华, 李文兵, 等. 东胜褐煤吡啶抽提的FTIR谱及GC/MS研究[J]. 煤炭技术, 2017, 36(3): 304-306. https://www.cnki.com.cn/Article/CJFDTOTAL-MTJS201703116.htmLiu Y, Wang G H, Li W B, et al. FTIR and GC/MS study on pyridine extraction of Dongsheng lignite[J]. Coal Technology, 2017, 36 (3): 304-306(in Chinese with English abstract). https://www.cnki.com.cn/Article/CJFDTOTAL-MTJS201703116.htm [22] 张代钧, 鲜学福. 红外光谱法研究煤大分子结构[J]. 光谱学与光谱分析, 1989, 9(3): 17-19, 24. https://www.cnki.com.cn/Article/CJFDTOTAL-GUAN198903004.htmZhang D J, Xian X F. Study on macromolecular structure of coal by infrared spectroscopy[J]. Spectroscopy and Spectral Analysis, 1989, 9(3): 17-19, 24(in Chinese with English abstract). https://www.cnki.com.cn/Article/CJFDTOTAL-GUAN198903004.htm [23] 徐鑫. 近30年来俄罗斯煤炭工业发展及未来趋势[J]. 中国煤炭, 2021, 47(2): 102-109. https://www.cnki.com.cn/Article/CJFDTOTAL-ZGME202102016.htmXu X. Development and future trend of Russian coal industry in recent 30 years[J]. China Coal, 2021, 47(2): 102-109(in Chinese with English abstract). https://www.cnki.com.cn/Article/CJFDTOTAL-ZGME202102016.htm [24] 陈景阳, 蔡文杰, 张洋, 等. 俄罗斯主要含油气盆地油气地质特征与成藏模式[J]. 地质科技情报, 2017, 36(5): 76-84. https://www.cnki.com.cn/Article/CJFDTOTAL-DZKQ201705011.htmChen J Y, Cai W J, Zhang Y, et al. Geological characteristics and reservoir formation patterns of oil and gas in major oil-bearing basins in Russia[J]. Geological Science and Technology Information, 2017, 36(5): 76-84(in Chinese with English abstract). https://www.cnki.com.cn/Article/CJFDTOTAL-DZKQ201705011.htm [25] Yanovsky A B. Main trends and prospects of the coal industry development in Russia[J]. Ugol, 2017(8): 10-16. [26] Tarazanov I, Gubanov D A. Russia's coal industry performance for January-December, 2019[J]. Ugol, 2020(3): 54-69. [27] 梁富康, 苏新旭. 印度尼西亚的煤炭资源及开发前景[J]. 中国煤炭, 2019, 45(4): 128-132. doi: 10.3969/j.issn.1006-530X.2019.04.024Liang F K, Su X X. Coal resources and development prospects in Indonesia[J]. China Coal, 2019, 45 (4): 128-132(in Chinese with English abstract). doi: 10.3969/j.issn.1006-530X.2019.04.024 [28] 赵风顺, 华杉, 吴昊, 等. 印度尼西亚苏门答腊岛浅成低温热液型金(银)矿产资源总量预测[J]. 地质科技通报, 2021, 40(1): 119-131. doi: 10.19509/j.cnki.dzkq.2021.0107Zhao F S, Hua S, Wu H, et al. Prediction of total mineral resources of asami low-temperature hydrothermal gold (silver) in Sumatra, Indonesia[J]. Bulletin of Geology and Science and Technology, 2021, 40(1): 119-131(in Chinese with English abstract). doi: 10.19509/j.cnki.dzkq.2021.0107 [29] Mulyono J. Indonesian coal industry outlook[Z]. Tokyo: Indonesian Japan Coal Policy Dialogue and Coal Seminar, 2009: 1-29. [30] Belkin H E, Tewalt S J, Hower J C, et al. Geochemistry and petrology of selected coal samples from sumatra, kaliman-tan, sulawesi, and papua, indonesia[J]. Internationalournal of Coal Geology, 2009: 260-268. [31] 蓝晓梅, 李艳强. 澳大利亚煤炭工业发展趋势[J]. 中国煤炭, 2021, 47(2): 89-101. https://www.cnki.com.cn/Article/CJFDTOTAL-ZGME202102015.htmLan X M, Li Y Q. Development trend of Australian coal industry[J]. China Coal, 2021, 47(2): 89-101(in Chinese with English abstract). https://www.cnki.com.cn/Article/CJFDTOTAL-ZGME202102015.htm [32] 黄科. 澳大利亚煤炭行业优势仍在[N]. 期货日报, 2018-01-16(3).Huang K. Advantages of Australian coal industry still exist. Futures daily, January 16, 2018 (3)(in Chinese). [33] Falkner A J, 李蕙生. 澳大利亚鲍恩盆地三角洲和冲积层序的定量分析[J]. 地质科技情报, 1991, 10(4): 97-96. https://www.cnki.com.cn/Article/CJFDTOTAL-DZKQ199104033.htmFalkner A J, Li H S. Quantitative analysis of delta and alluvial sequence in Bowen Basin, Australia[J]. Geological Science and Technology Information, 1991, 10(4): 97-96(in Chinese). https://www.cnki.com.cn/Article/CJFDTOTAL-DZKQ199104033.htm [34] Niu X, Yang X H, Yan D T, et al. Development background of Mesozoic high-quality source rocks: Evidence from microfossils in North Carnarvon Basin, Australia[J]. Petroleum Research, 2019, 4(1): 71-83. doi: 10.1016/j.ptlrs.2019.01.005 [35] Granato D, Santos J S, Escher G B, et al. Use of principal component analysis (PCA) and hierarchical cluster analysis (HCA) for multivariate association between bioactive compounds and functional properties in foods: A critical perspective[J]. Trends Food Sci. Technol., 2018, 72: 83-90. doi: 10.1016/j.tifs.2017.12.006 [36] Liu Y, Xia Z Z, Yao L Y, et al. Discriminating geographic origin of sesame oils and determining lignans by near-infrared spectroscopy combined with chemometric methods[J]. Food Compos. Anal., 2019, 84: 103-327. [37] Liu L, Cozzolono D, Cynkar W U, et al. Preliminary study on the application of visible-near infrared spectroscopy and chemometrics to classify Riesling wines from different countries[J]. Food Chemistry, 2008, 106(2): 781-786. doi: 10.1016/j.foodchem.2007.06.015 [38] 张代钧, 鲜学福. 煤大分子中官能团的红外光谱分析[J]. 重庆大学学报: 自然科学版, 1990, 10(5): 63-67. https://www.cnki.com.cn/Article/CJFDTOTAL-FIVE199005010.htmZhang D J, Xian X F. Infrared spectrum analysis of functional groups in coal macromolecules[J]. Journal of Chongqing University: Natural Science Edition, 1990, 10(5): 63-67(in Chinese with English abstract). https://www.cnki.com.cn/Article/CJFDTOTAL-FIVE199005010.htm [39] Ganz H, Kalkreuth W. Application of infrared spectroscopy to the classification of kerogen types and the evolution of source rock and oil-shale potentials[J]. Fuel, 1987, 66(5): 708-711. doi: 10.1016/0016-2361(87)90285-7 [40] 郑庆荣, 曾凡桂, 张世同. 中变质煤结构演化的FT-IR分析[J]. 煤炭学报, 2011, 36(3): 481-486. https://www.cnki.com.cn/Article/CJFDTOTAL-MTXB201103025.htmZheng Q R, Zeng F G, Zhang S T. FT-IR analysis of structural evolution of medium-metamorphic coal[J]. Journal of China Coal Society, 2011, 36(3): 481-486(in Chinese with English abstract). https://www.cnki.com.cn/Article/CJFDTOTAL-MTXB201103025.htm [41] Ibarra J V, Miliner R, Bonet A J. FT-IR investigation on char formation during the early stages of coal pyrolysis[J]. Fuel, 1994, 73(6): 918-924. -

 下载:
下载:


 点击查看大图

计量
- 文章访问数: 684
- PDF下载量: 44
- 被引次数: 0
