


Sources, transport and transformation of nitrogen pollution in shalllow groundwater in Caidian District, Wuhan, China
-
摘要:
近年来,随着人类活动的不断加剧,地下水氮污染成为全球范围内典型的环境问题。为识别浅层地下水氮污染源、贡献比例以及迁移转化特征,采集了湖北省武汉市蔡甸区主要供水区地表水样14个、浅层地下水样24个及土样7个,并测试分析了其水化学指标、氮同位素、氢氧同位素等。基于当地土地利用类型,综合水化学及$\delta^{15}{\mathrm{N}}\text{-}{\rm{NO}}^{-}_3 $、$\delta^{18}{\mathrm{O}}\text{-}{\rm{NO}}^{-}_3 $双同位素示踪技术,判别了研究区地下水硝酸盐氮污染源及迁移转化规律,同时进一步运用Iso-Source模型定量识别了不同氮污染源的贡献比例。区域氮污染类型以硝酸盐氮为主,其中约66.7%地下水采样点${\rm{NO}}^{-}_3 $浓度超出世界卫生组织(WHO)规定限值(10 mg/L),污水和粪便、土壤有机质以及氨肥硝化为主要${\rm{NO}}^{-}_3 $来源,其对浅层地下水硝酸盐氮的贡献率均值分别为48.6%、32.9%、18.5%,受较为明显的人类活动影响;进一步结合区域水化学及氢氧同位素组成显示,区域地表水及地下水氮的形态转化主要受到硝化作用影响与控制。研究结果将为进一步了解蔡甸区氮循环过程及氮污染治理提供理论基础。
Abstract:Objective In recent years, increasing human activities have exacerbated groundwater nitrogen pollution, which has become a typical environmental problem globally. To identify nitrogen pollution sources, contribution ratios, transport and transformation characteristics in shallow groundwater, fourteen surface water samples, four shallow groundwater samples, and seven soil samples were collected from the main water supply area of Caidian District, Wuhan City, Hubei Province. These samples were analyzed for water chemical indices, nitrogen isotopes, hydrogen and oxygen isotopes.
Methods Integrating the local land use type, water chemistry, and $\delta^{15}{\mathrm{N}}\text{-}{\rm{NO}}^{-}_3 $ and $\delta^{18}{\mathrm{O}}\text{-}{\rm{NO}}^{-}_3 $ double isotope tracer technology, we identified sources of nitrate nitrogen pollution and determine their transport and transformation patterns. The IsoSource model was further applied to quantitatively assess the contributions of different nitrogen pollution sources.
Results The predominant form of nitrogen pollution was nitrate nitrogen, with approximately 66.7% of the groundwater sampling points exceeded the WHO limit (10 mg/L) in ${\rm{NO}}^{-}_3 $ concentration. The primary sources of ${\rm{NO}}^{-}_3 $ were identified as nitrification of sewage and manure, soil organic matter, and ammonia-containing fertilizers, with average contribution rates to shallow groundwater of 48.6%, 32.9%, and 18.5%, respectively. These sources were found to be significantly affected by human activities. Further analysis integrating regional water chemistry and hydrogen-oxygen isotopic compositions revealed that the morphological transformation of nitrogen in regional surface and groundwater nitrogen was predominantly controlled by nitrification processes.
Conclusion The findings of this research provide a theoretical framework for better understanding the nitrogen cycling process and implementing effective nitrogen pollution control measures in Caidian District.
-
Key words:
- nitrogen pollution /
- nitrate nitrogen /
- Iso-Source model /
- dual isotope tracer technique /
- shallow groundwater /
- Wuhan
-
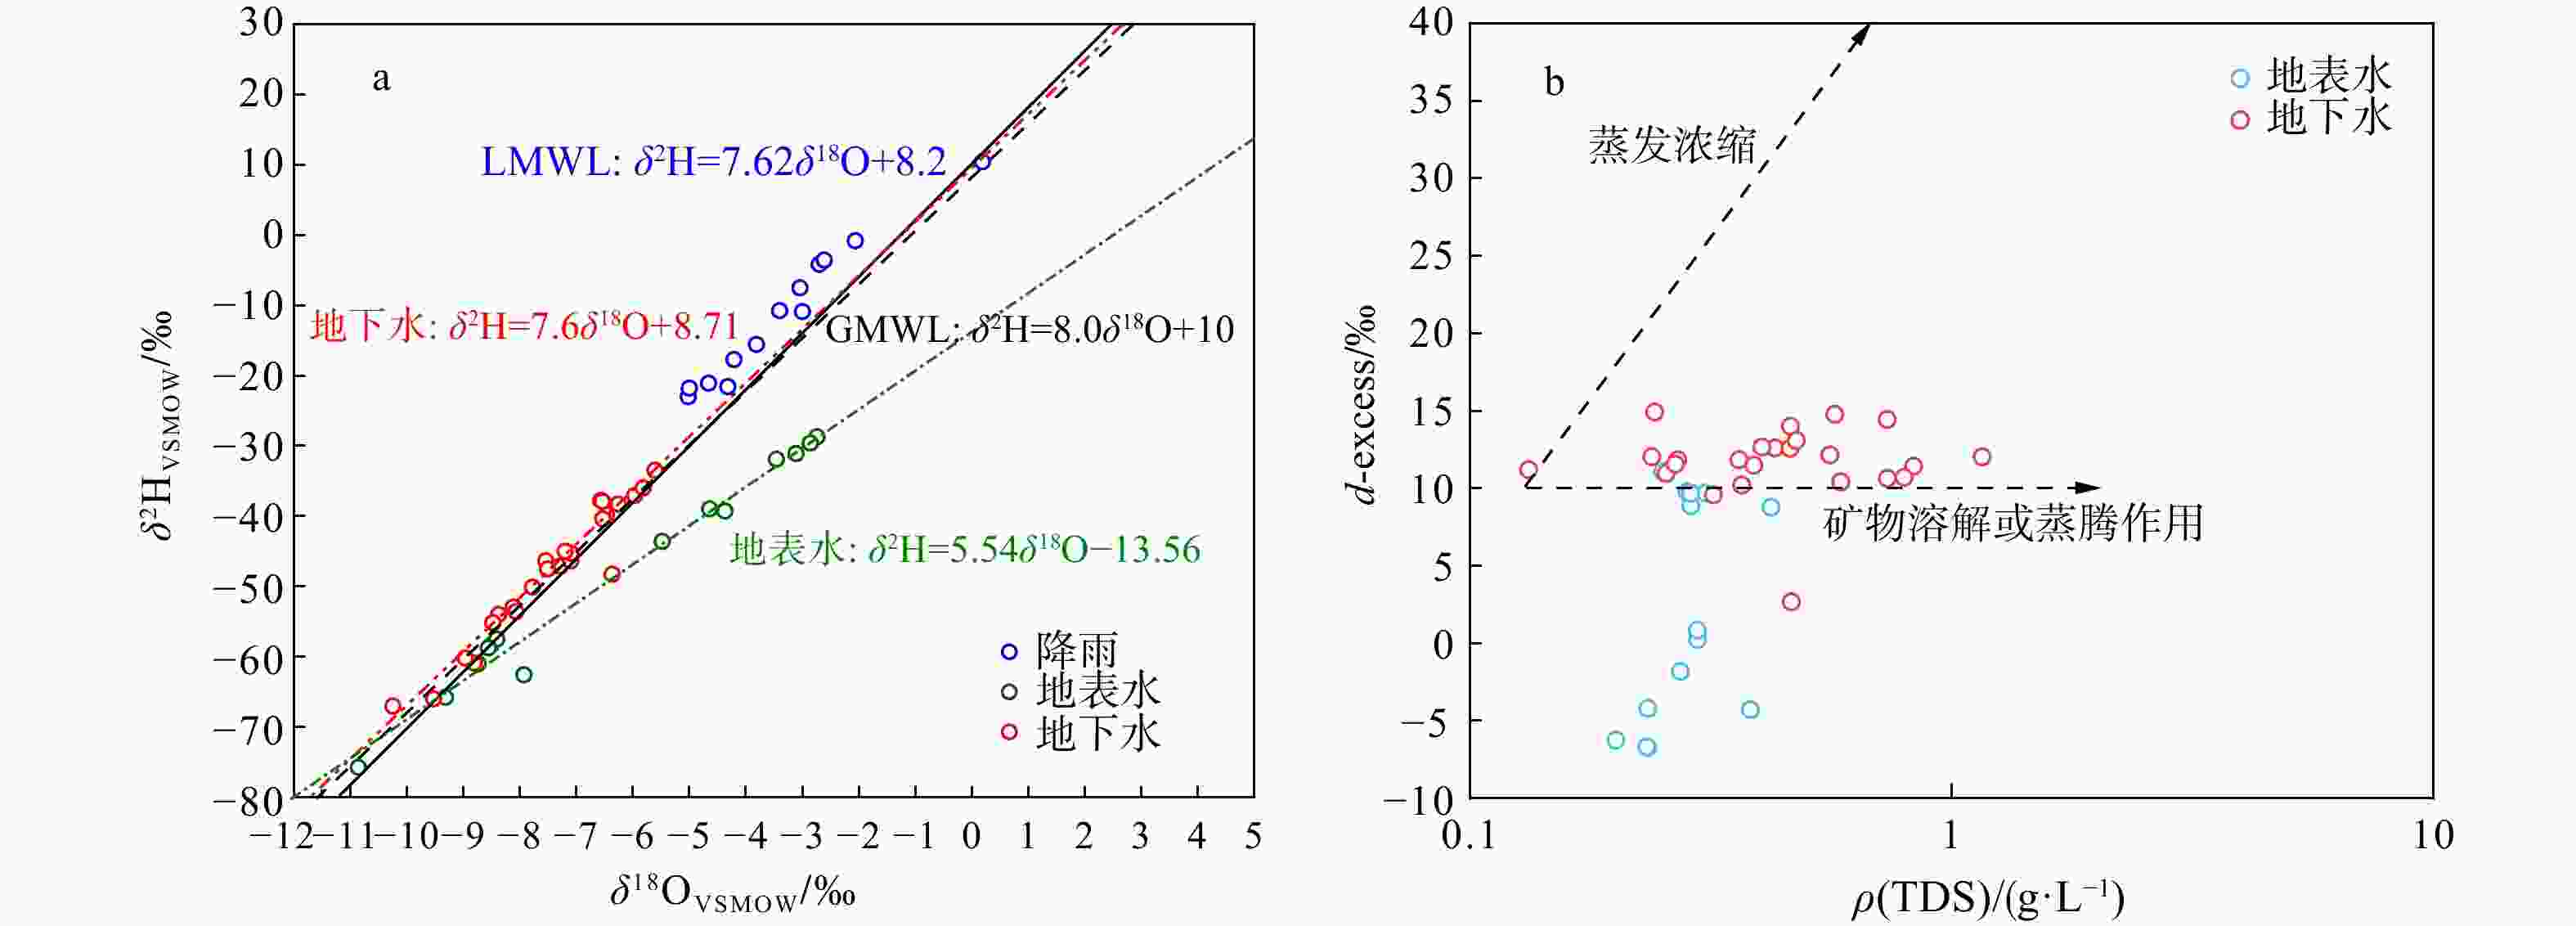
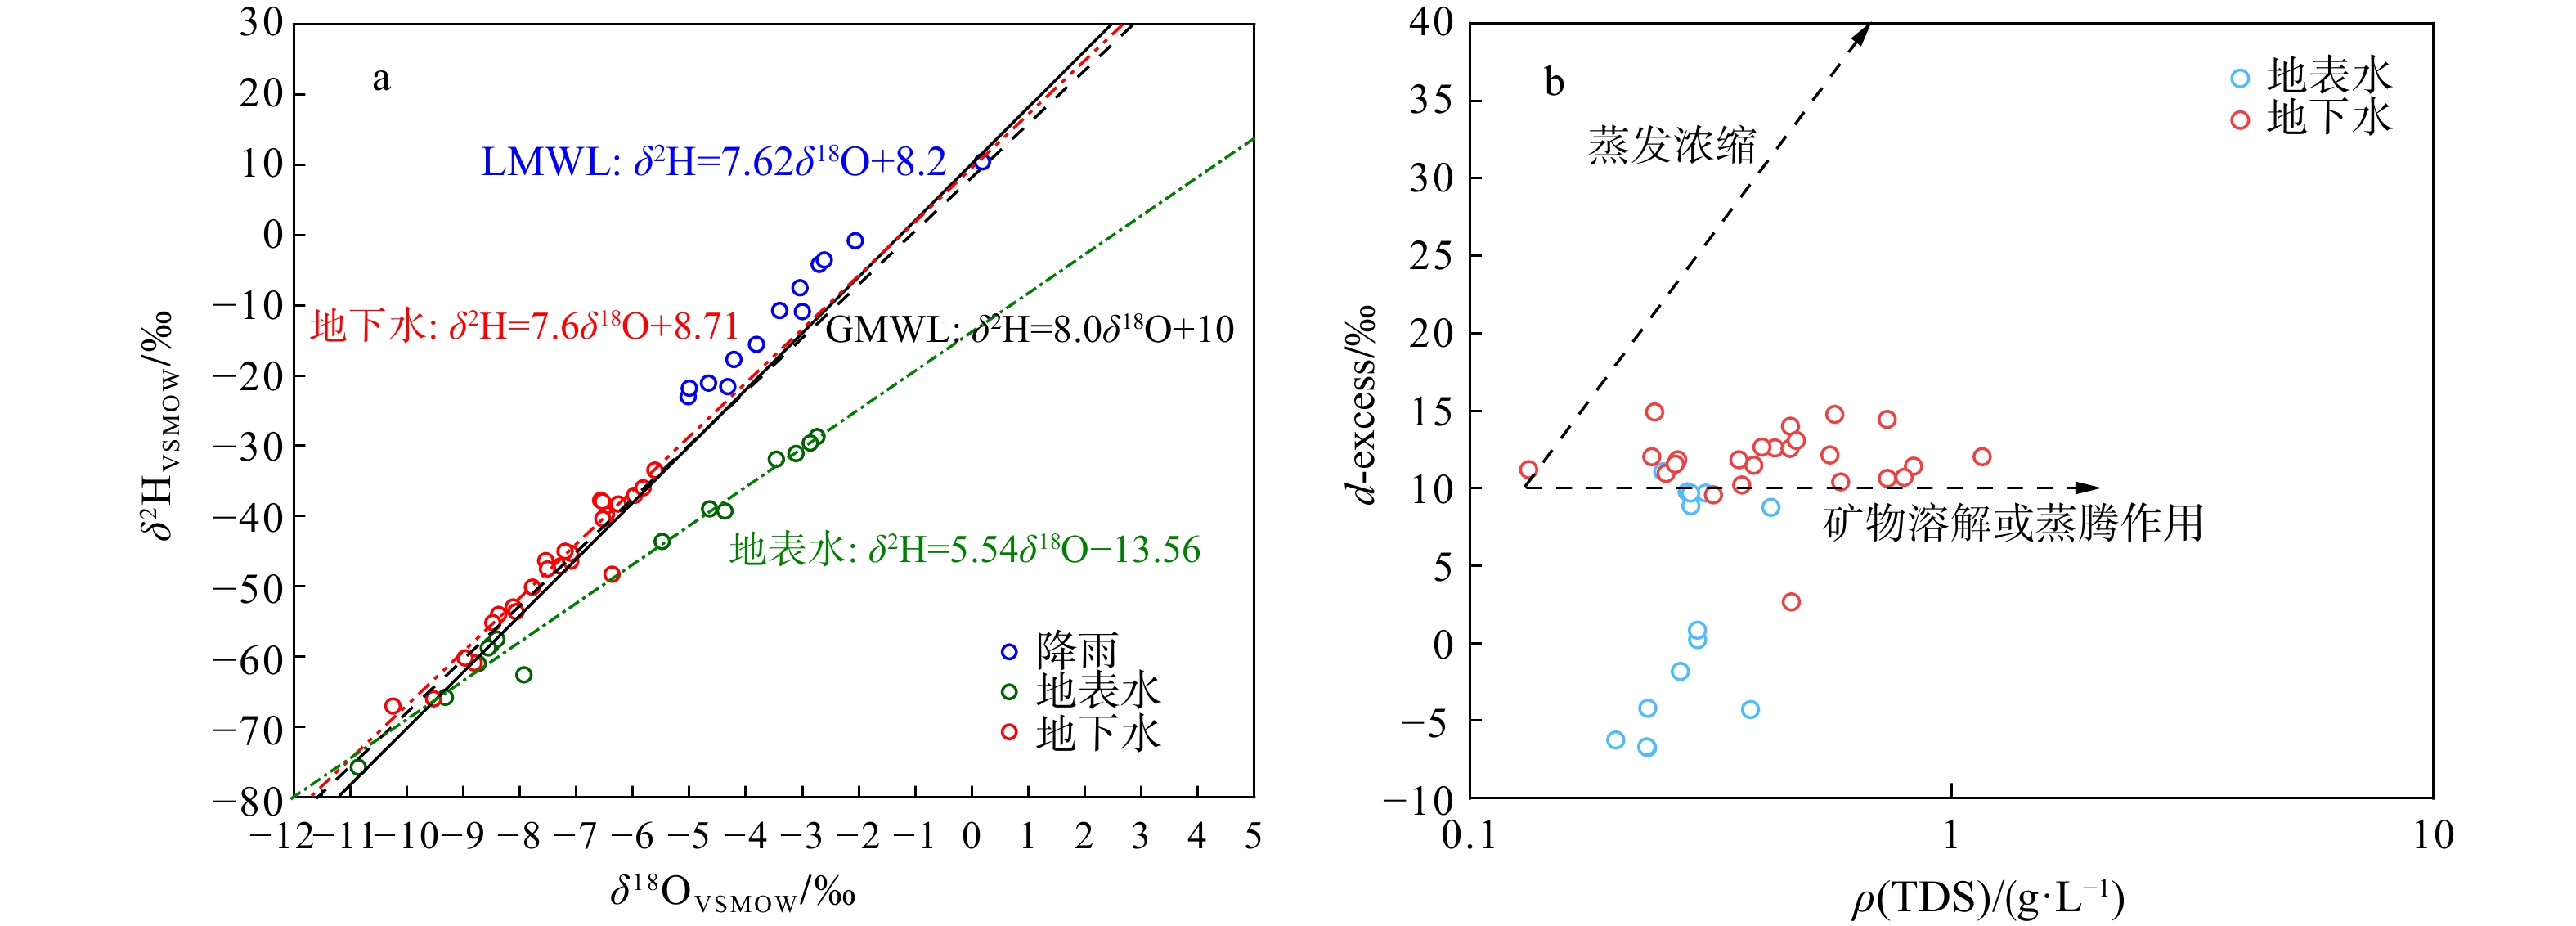
图 4 研究区水样氢氧同位素特征图
a. 研究区水样氢氧同位素图;b. d-excess与总溶解固体质量浓度ρ(TDS)关系图
Figure 4. Hydrogen and oxygen isotope characteristics of water samples in the study area
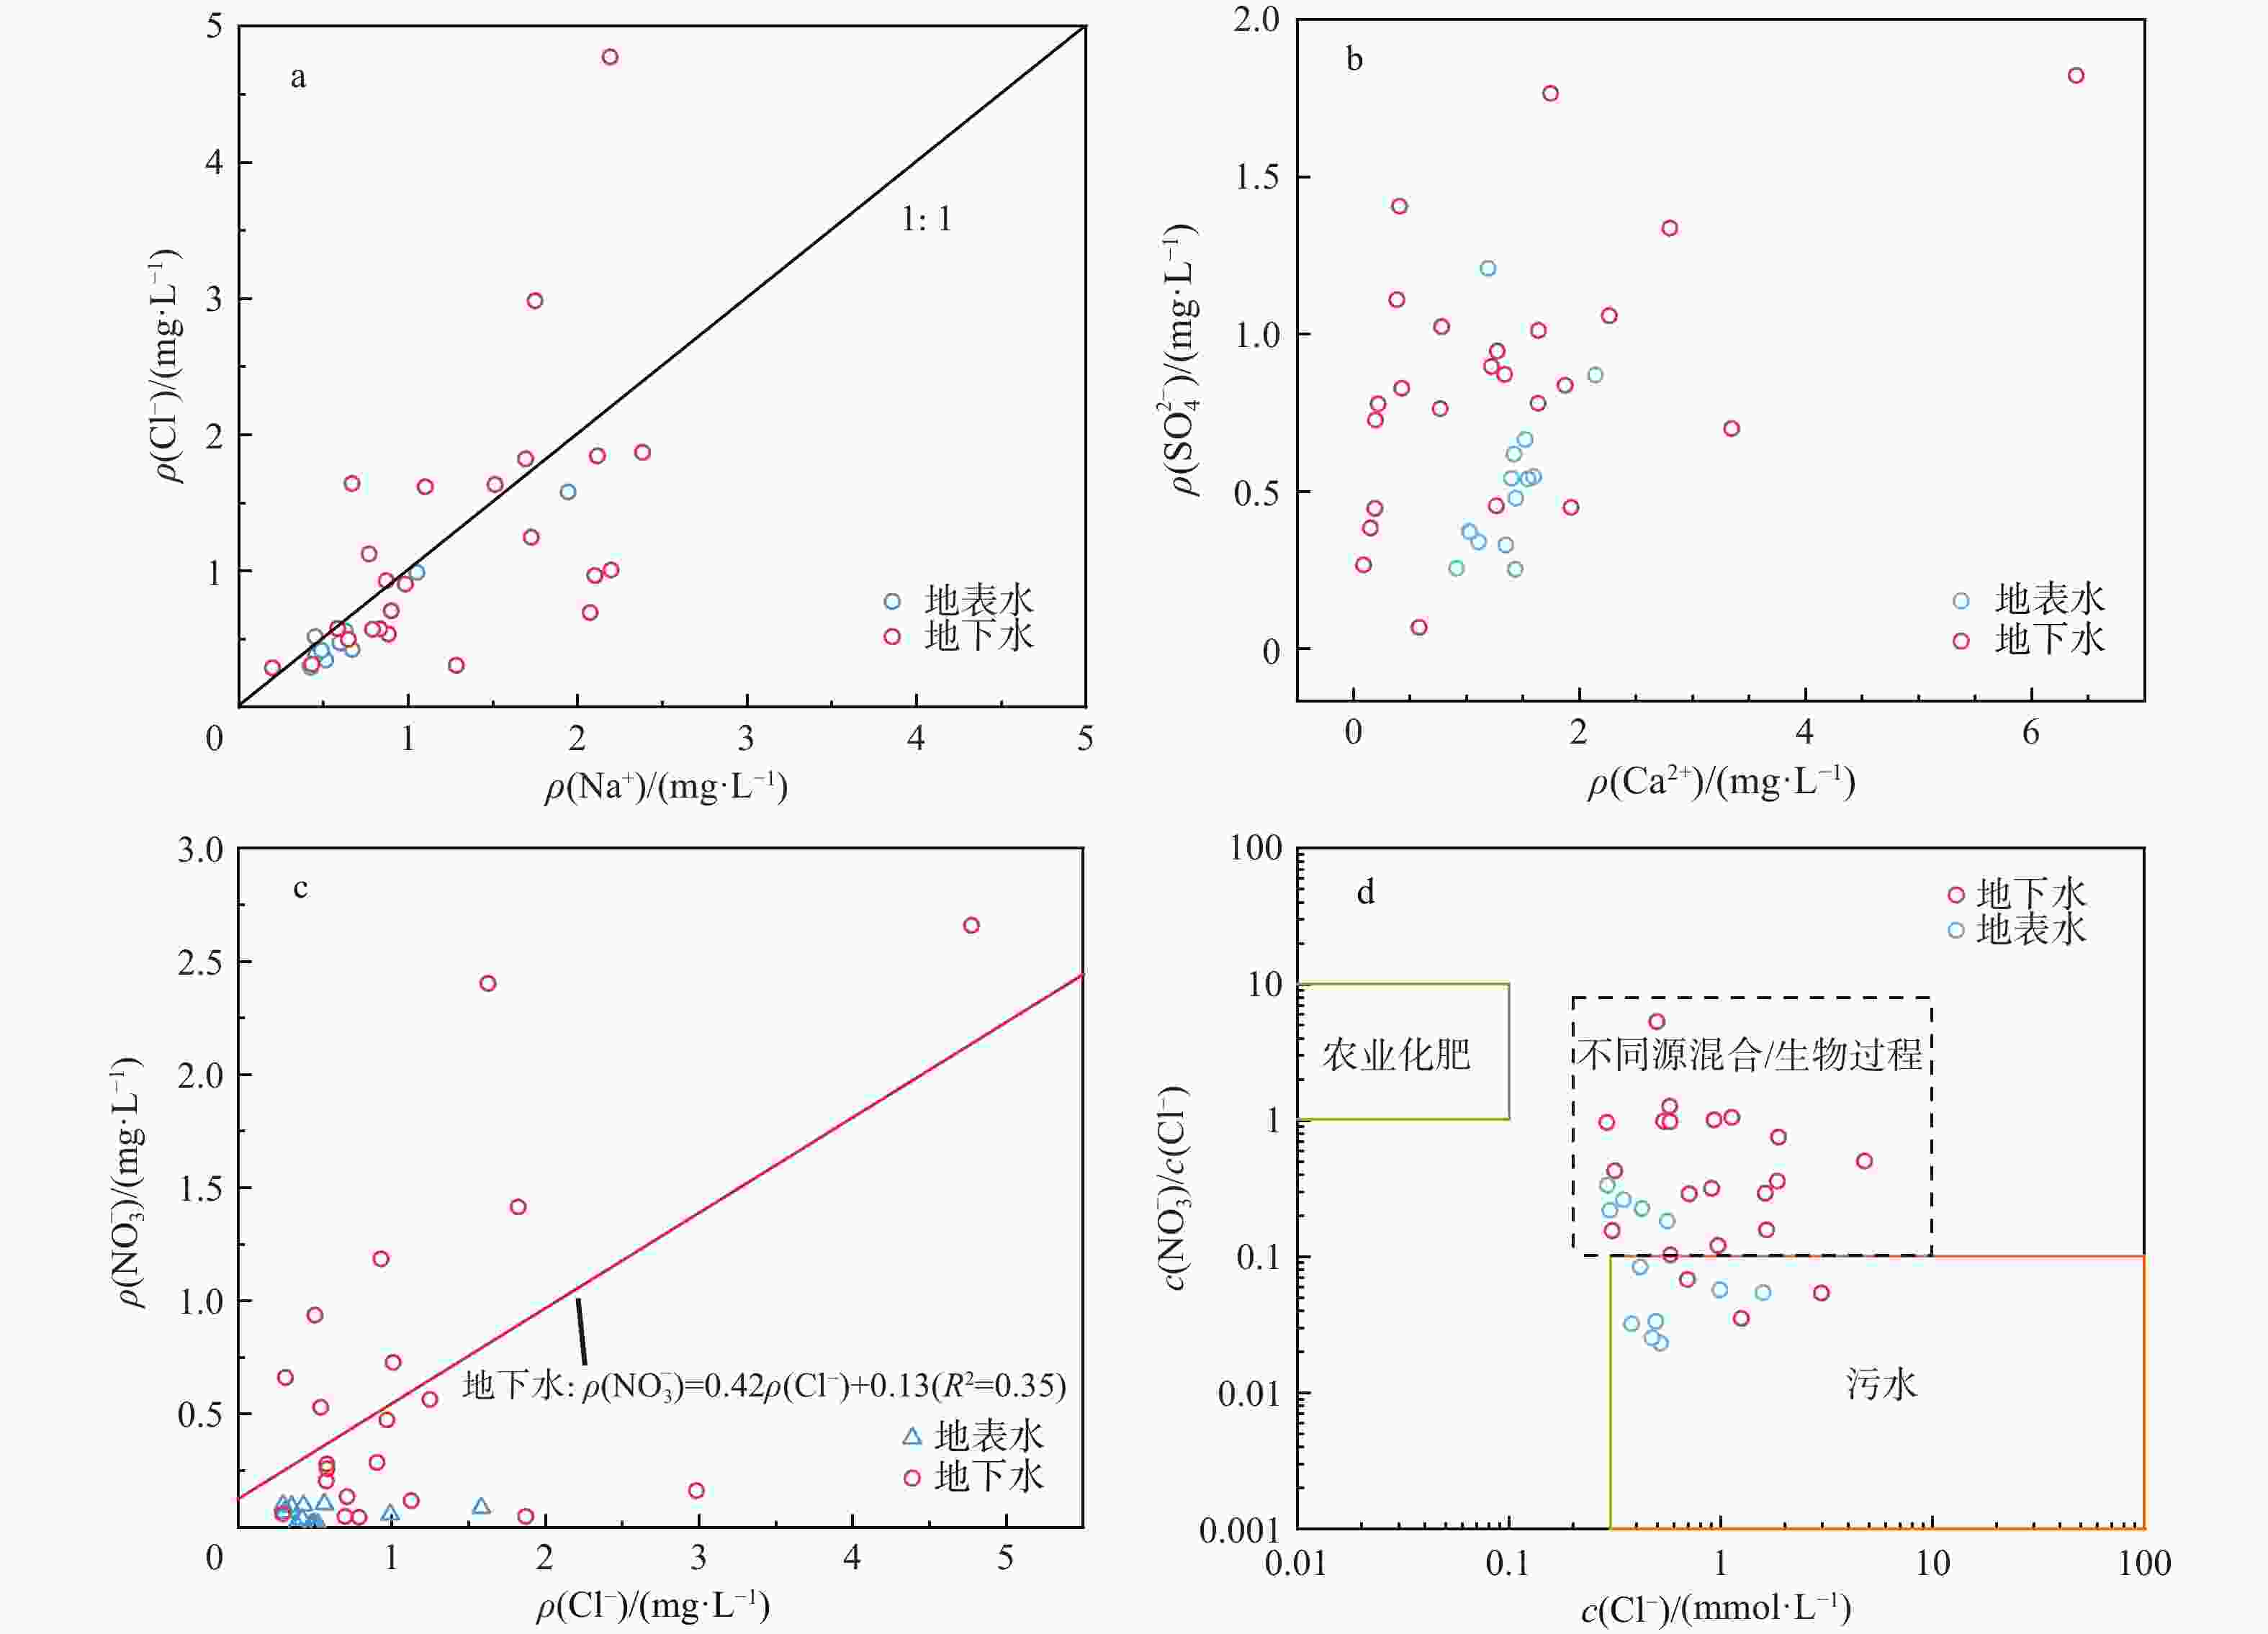
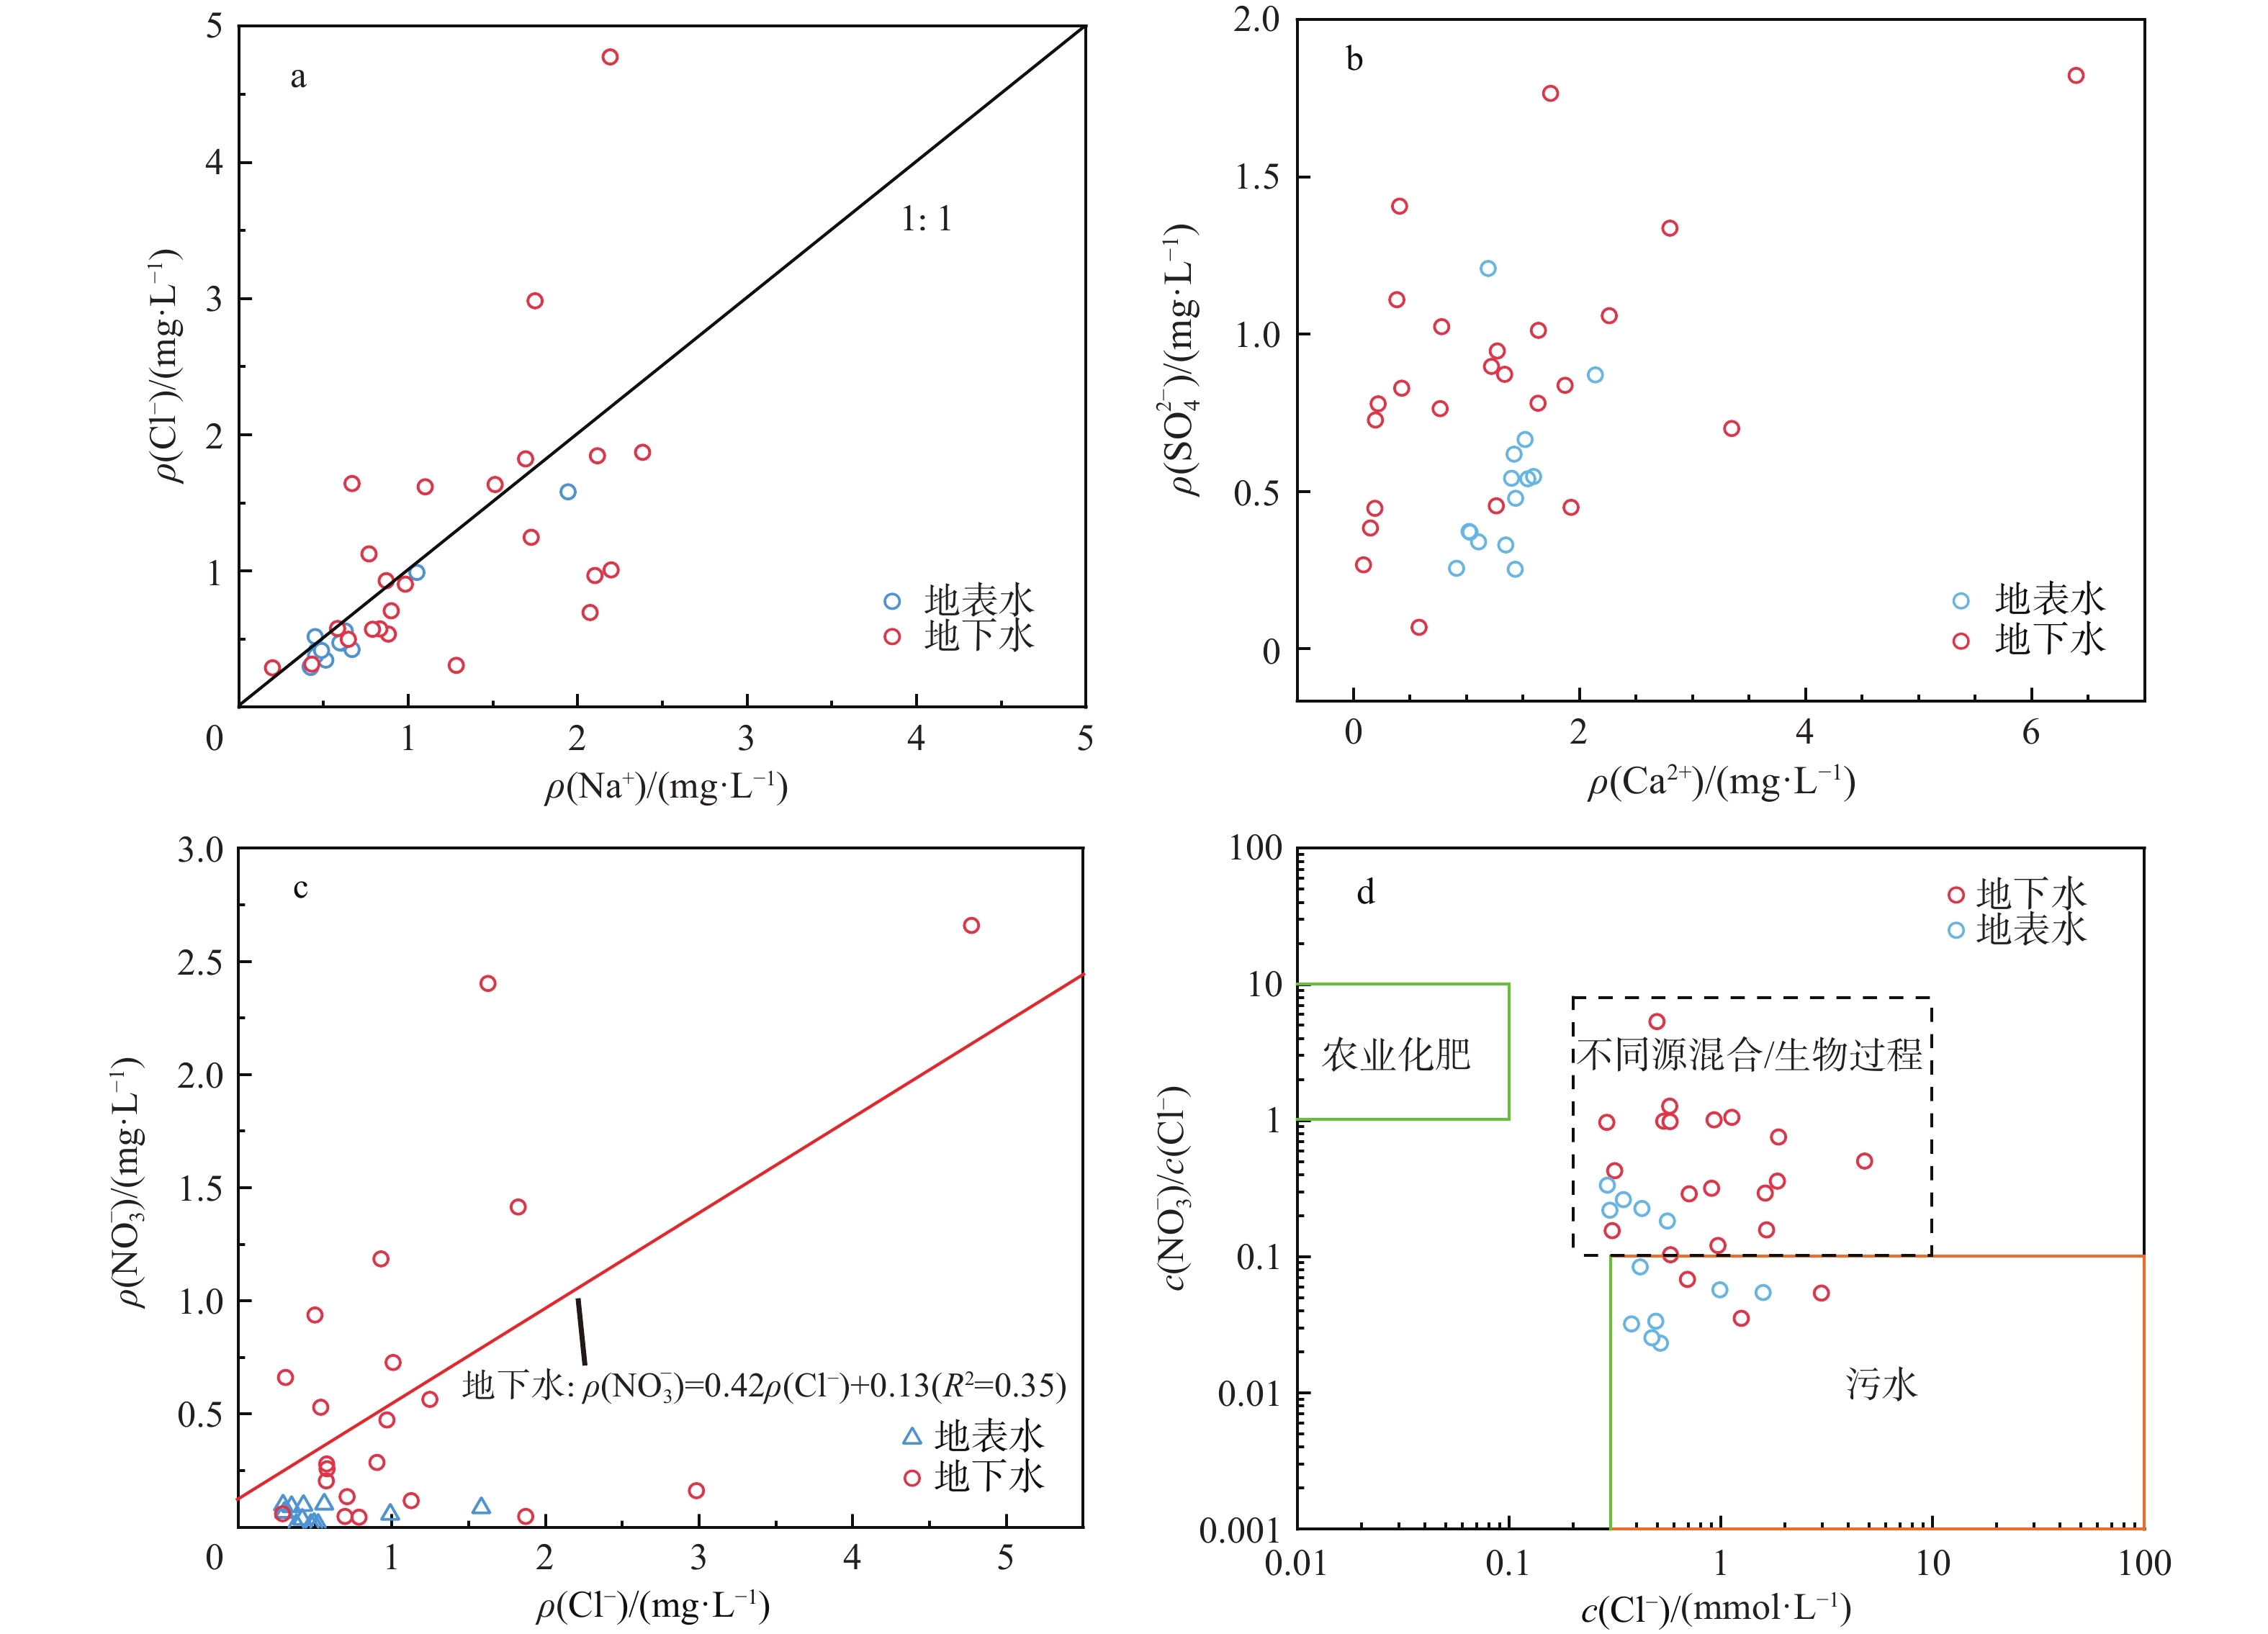
图 5 研究区水样离子比例系数图
a. ${\rm{Cl}}^{-} $与Na+关系图;b. ${\rm{SO}}^{2-}_4 $与Ca2+关系图;c. ${\rm{NO}}^{-}_3 $与${\rm{Cl}}^{-} $关系图;d. ${\rm{NO}}^{-}_3 $/${\rm{Cl}}^{-} $与${\rm{Cl}}^{-} $关系图
Figure 5. Ion proportional coefficients of water samples in the study area
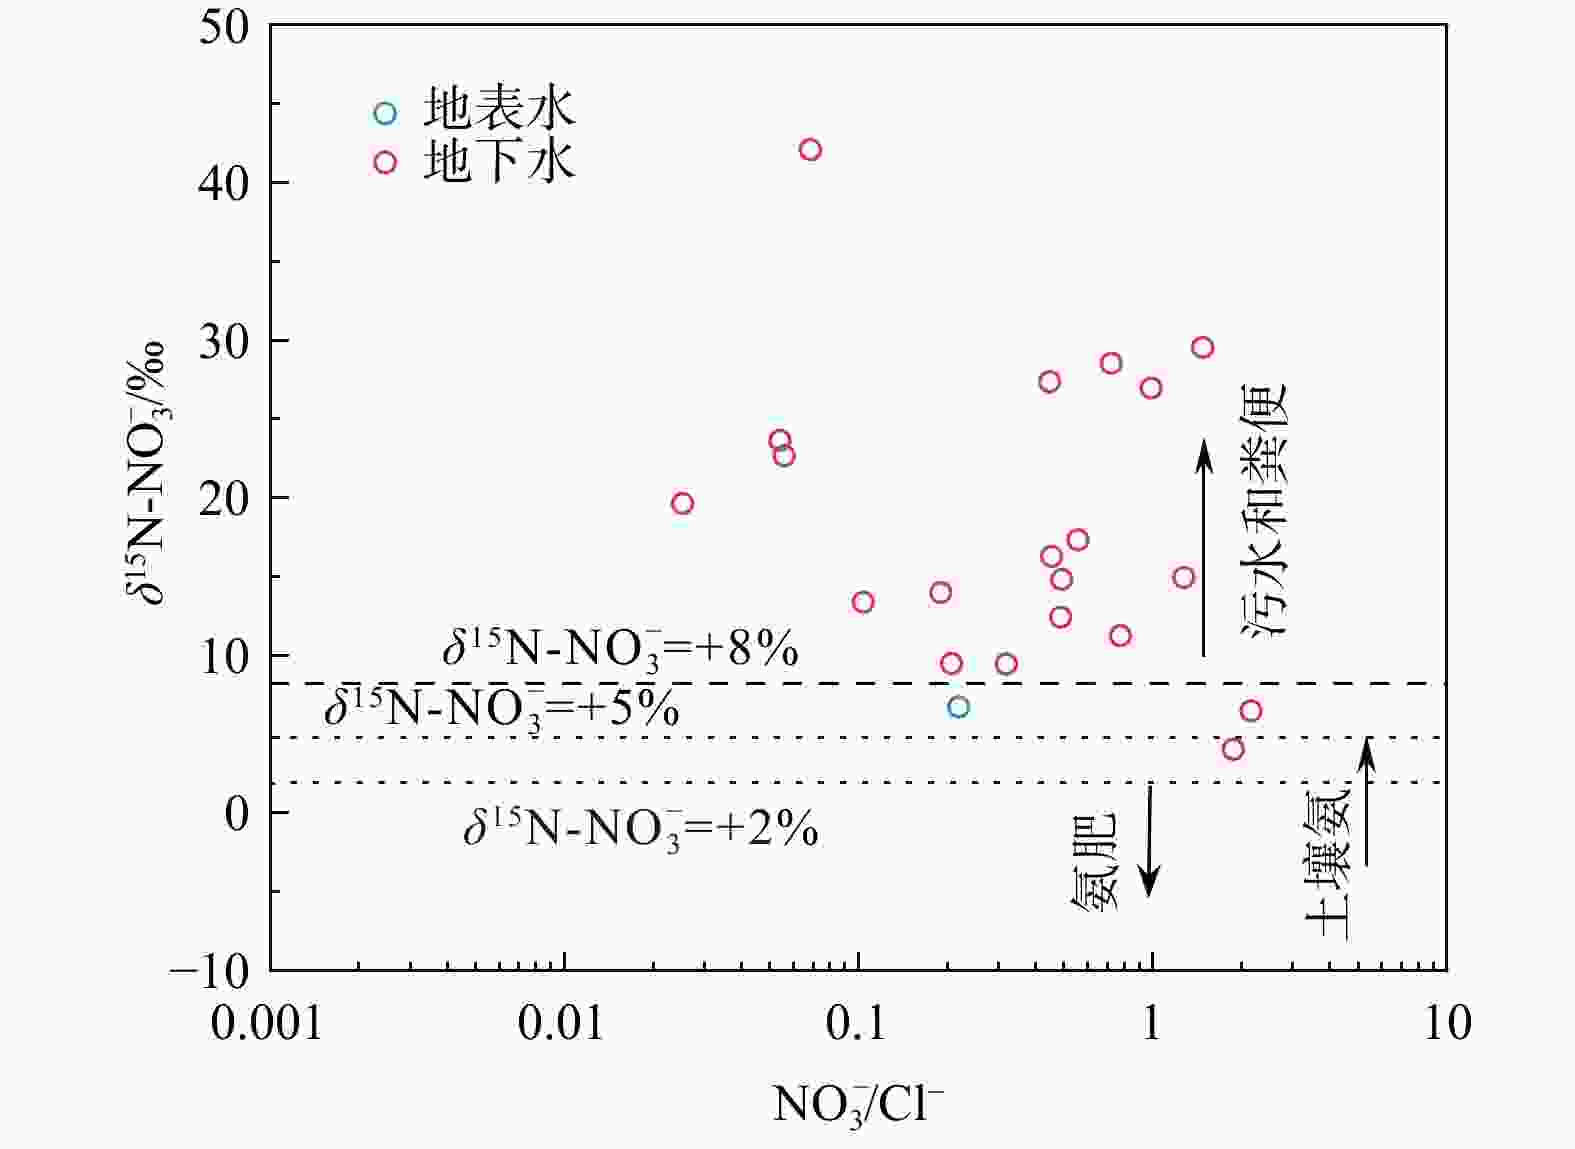
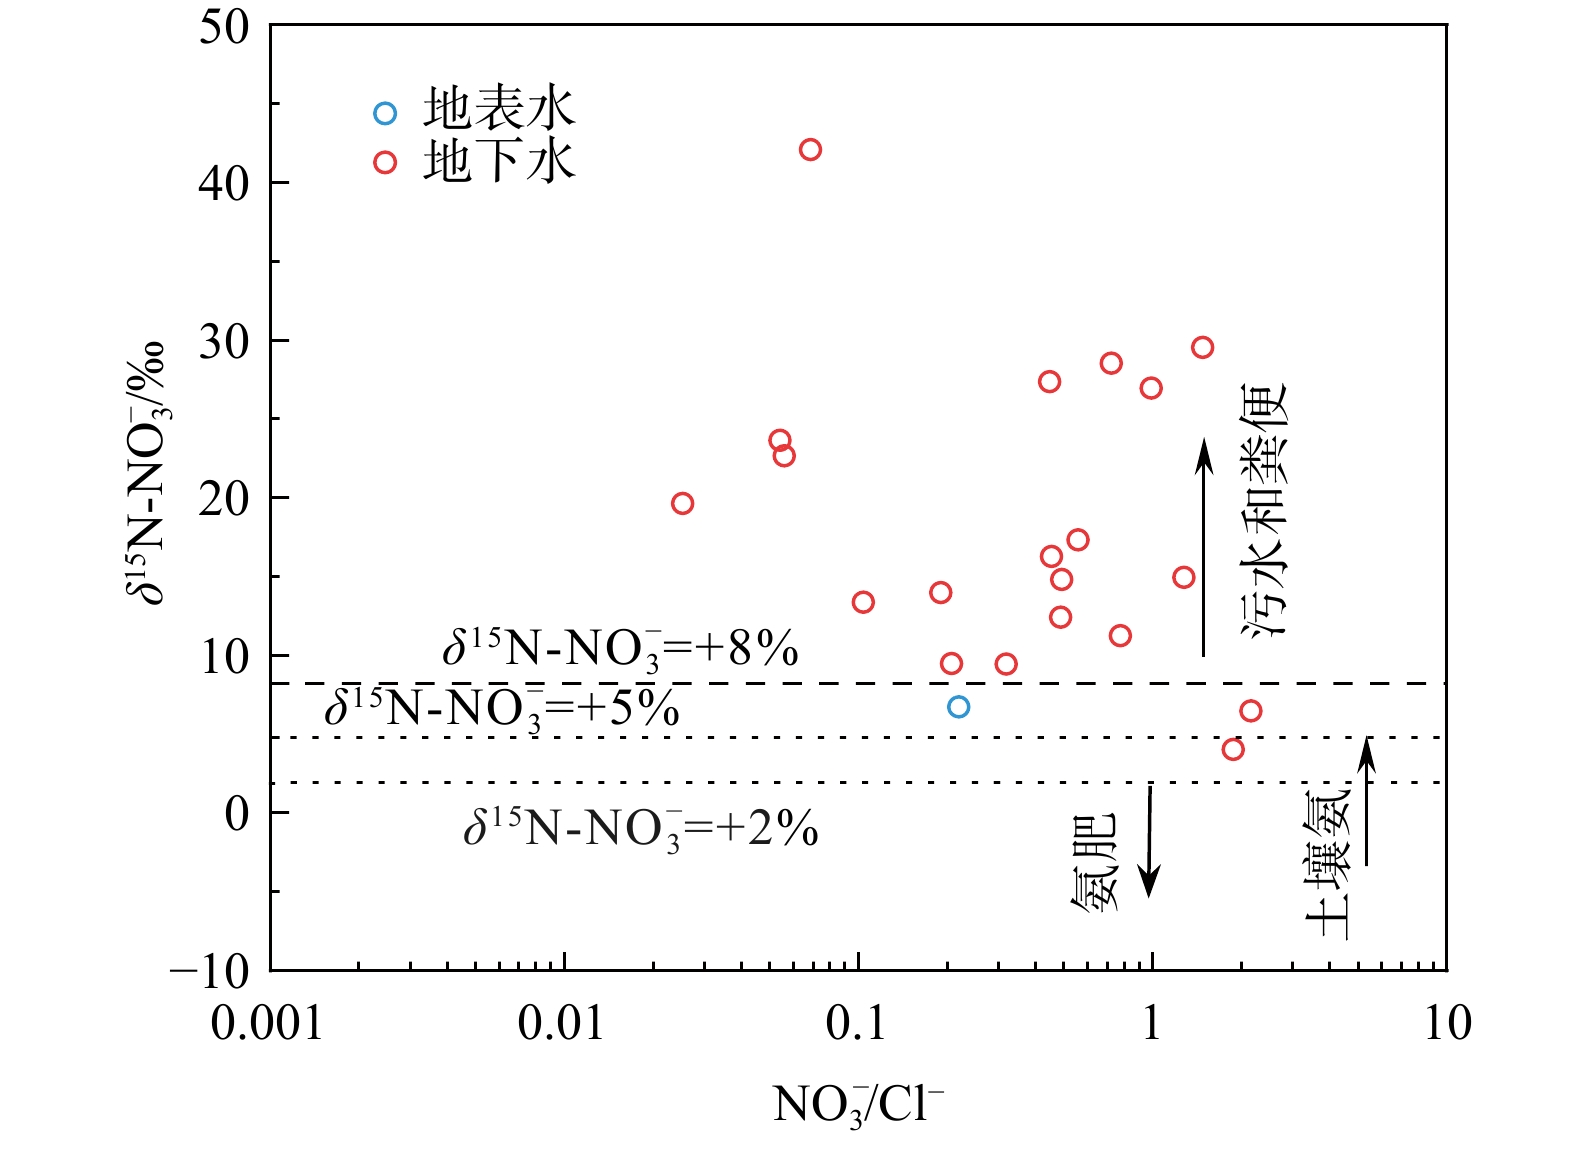
图 6 $\delta^{15}{\mathrm{N}}\text{-}{\rm{NO}}^{-}_3 $与${\rm{NO}}^{-}_3 $/${\rm{Cl}}^{-} $关系图
Figure 6. Relationship between $\delta^{15}{\mathrm{N}}\text{-}{\rm{NO}}^{-}_3 $ and ${\rm{NO}}^{-}_3 $/${\rm{Cl}}^{-} $

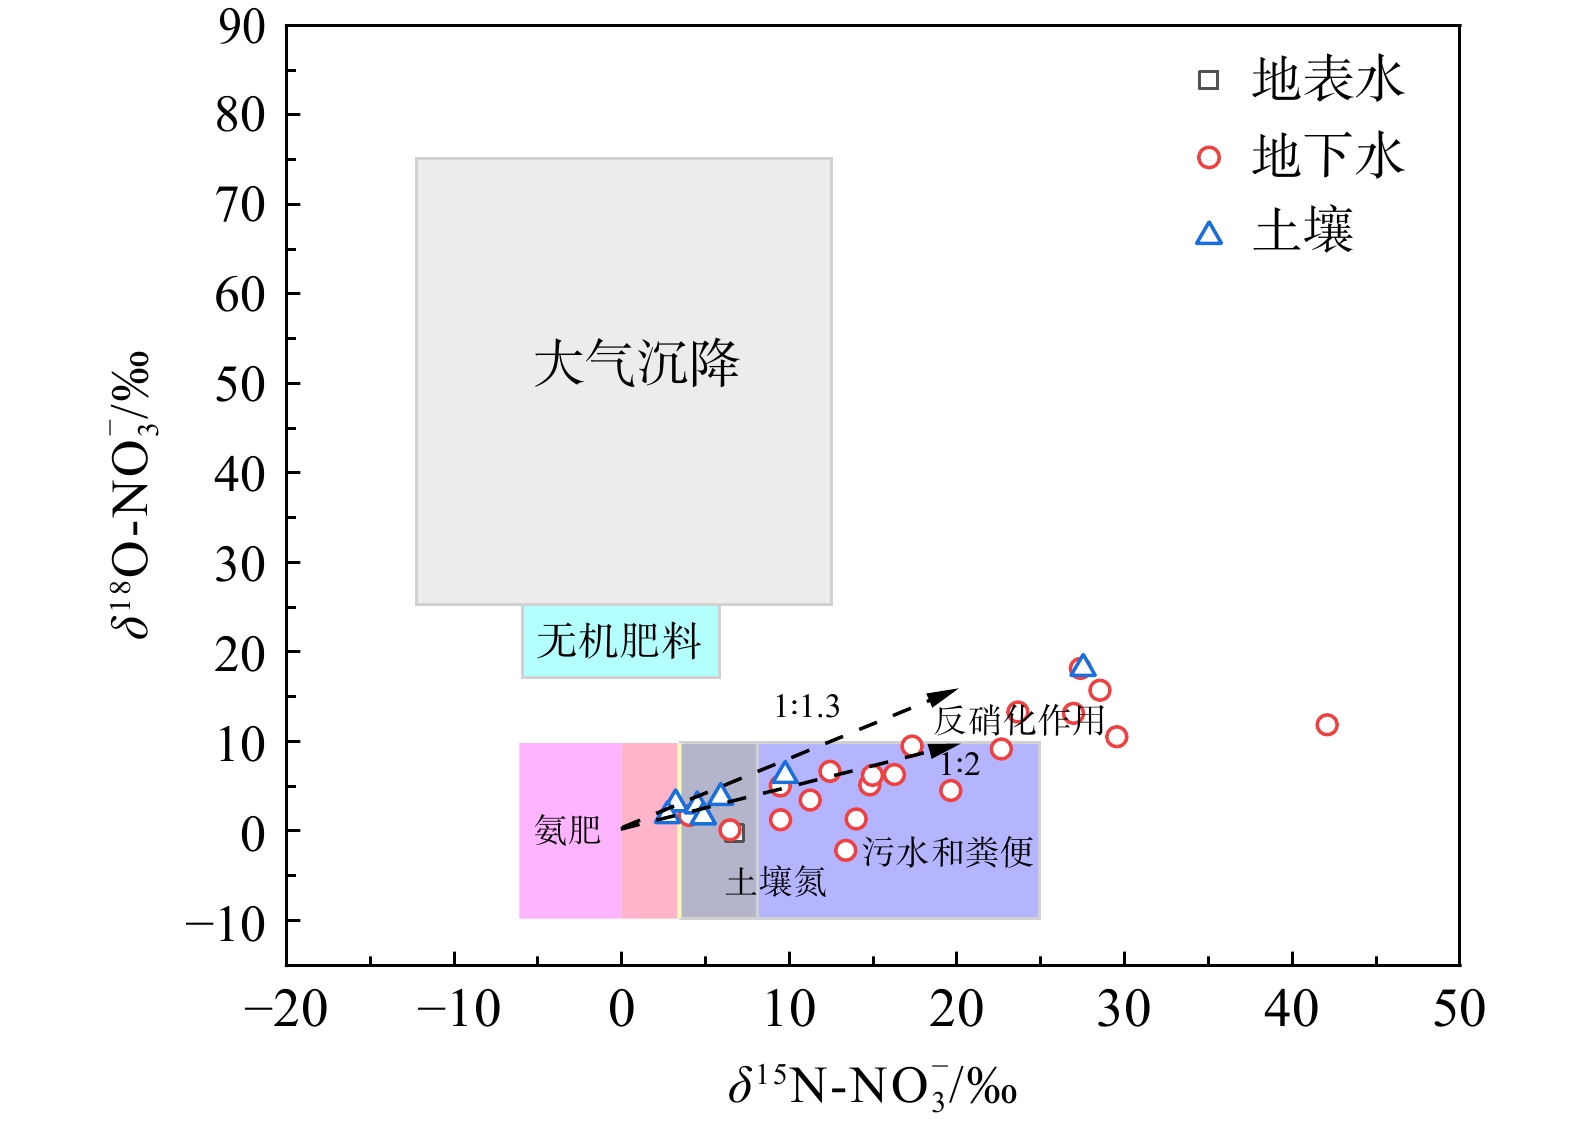
图 7 区域硝酸盐氮氧稳定同位素图
Figure 7. Regional map of nitrogen and oxygen stable isotopes of nitrate
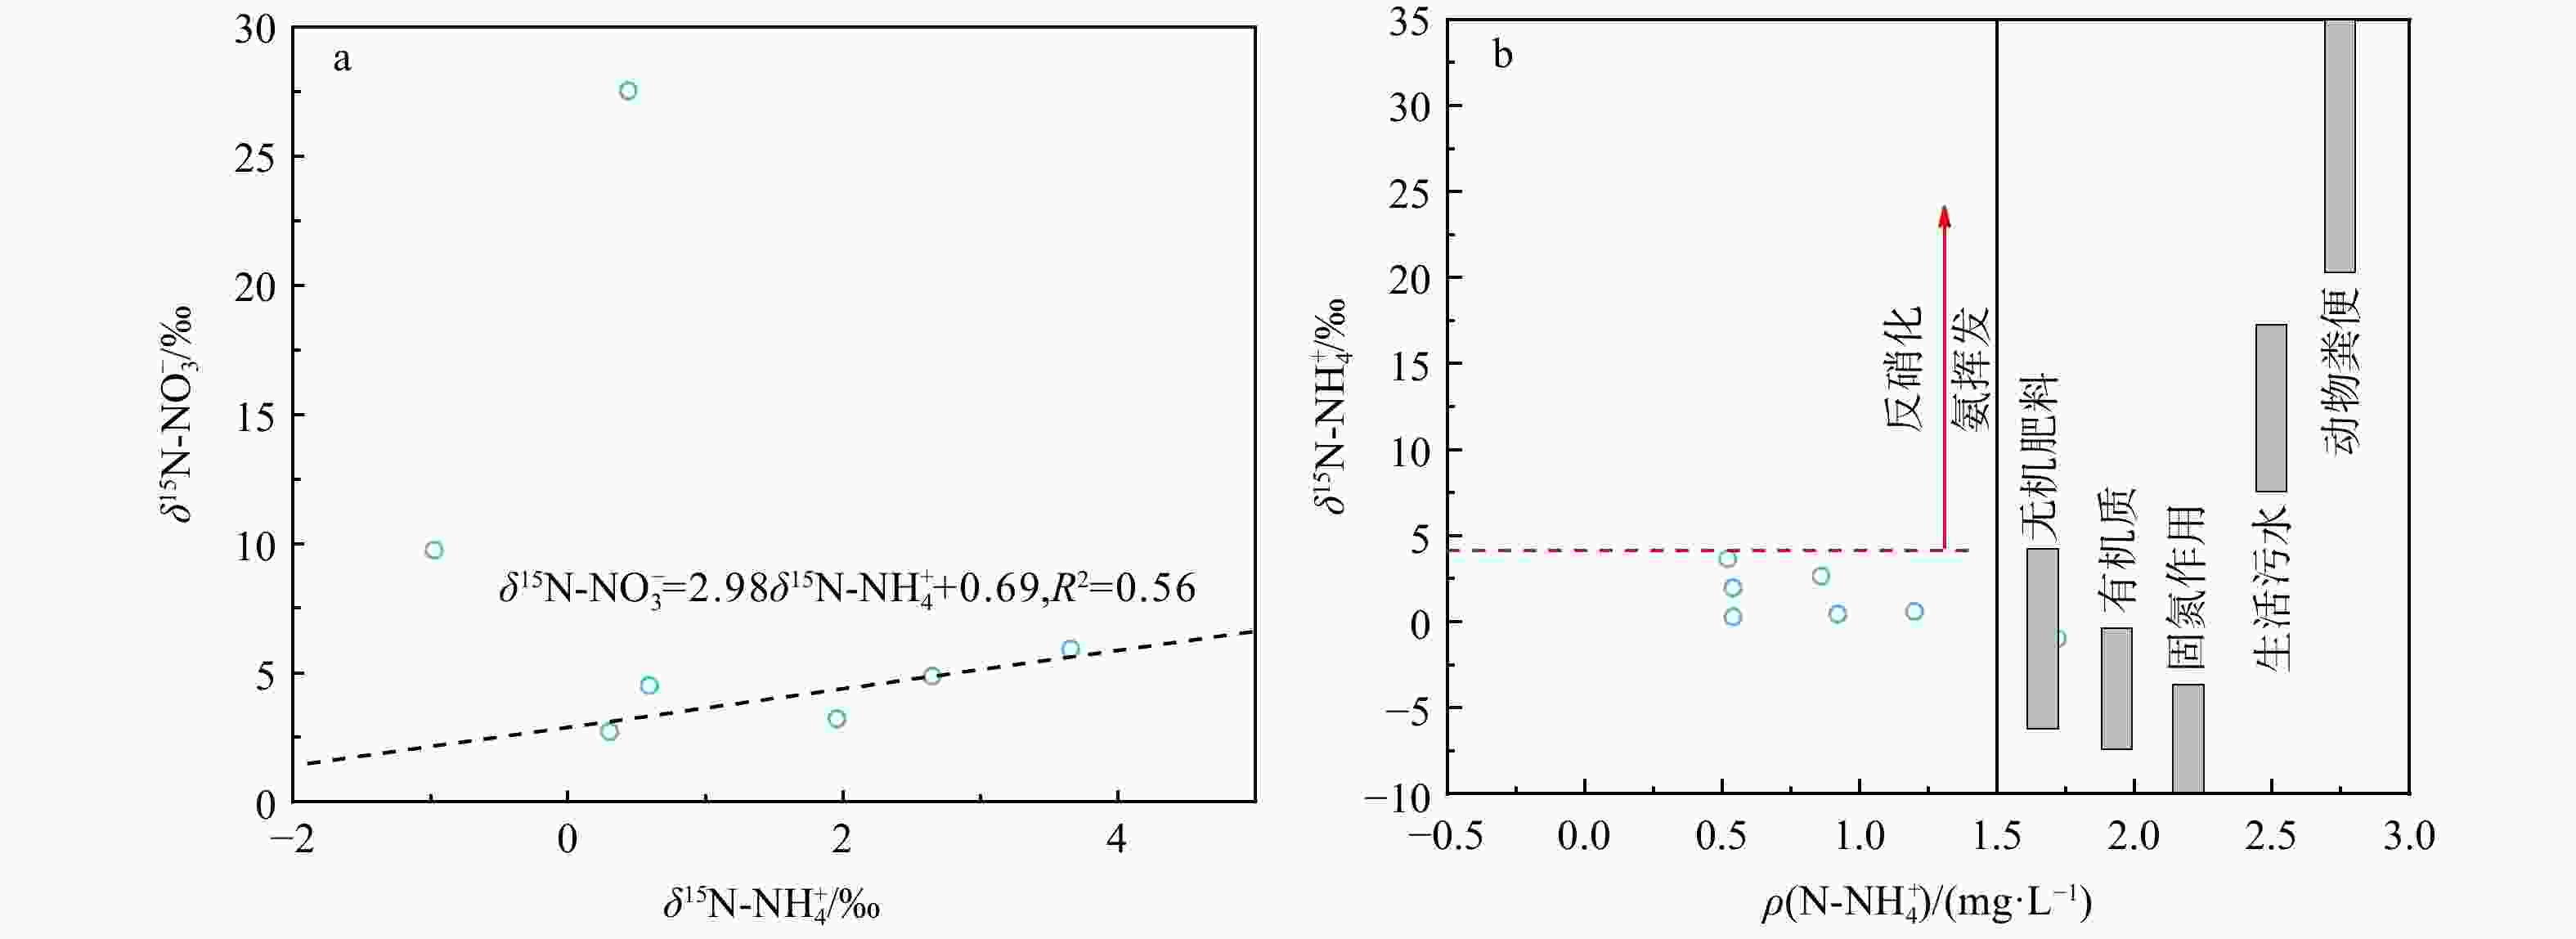
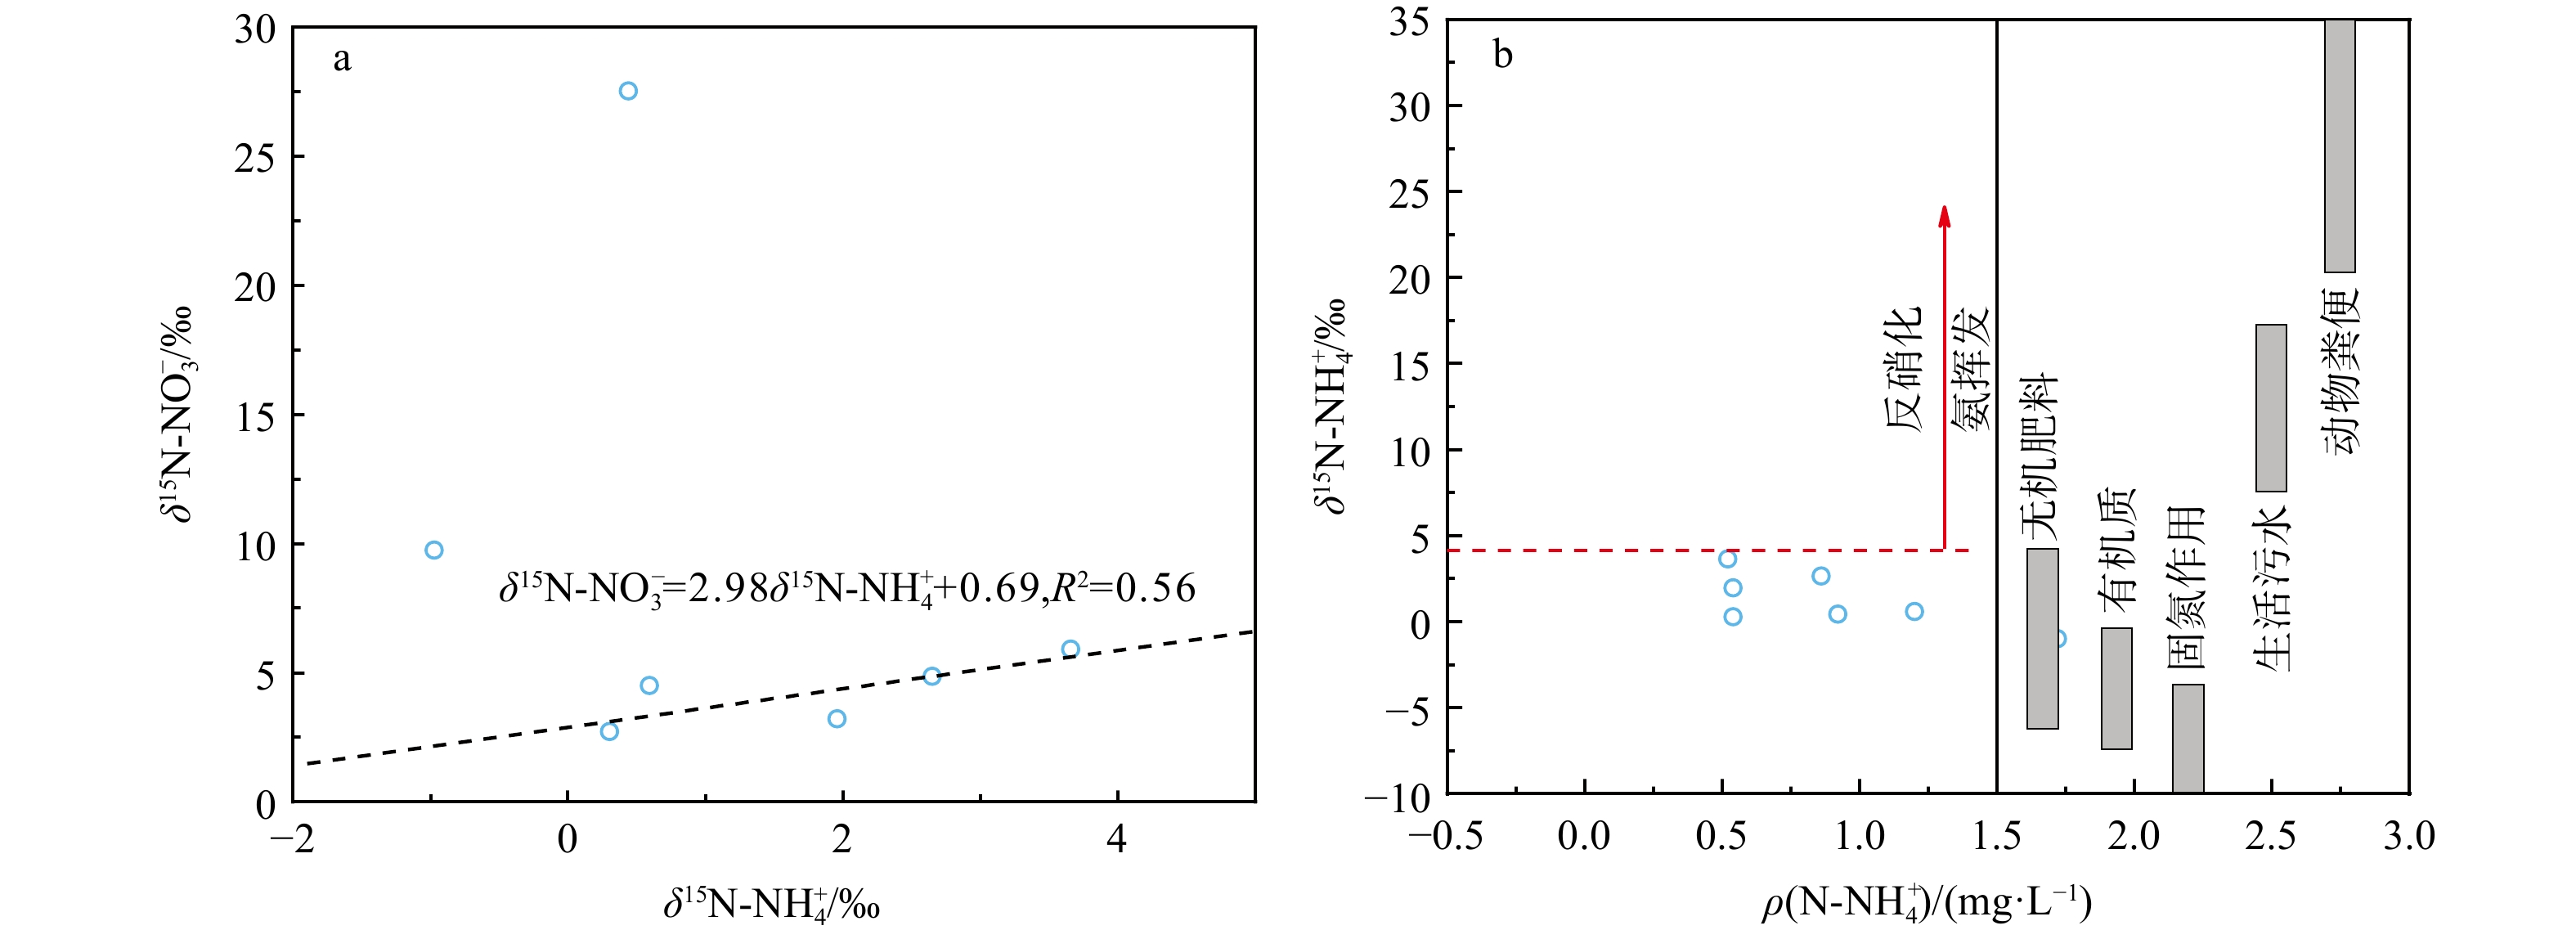
图 8 研究区土壤δ15N-NH4+与$\delta^{15}{\mathrm{N}}\text{-}{\rm{NO}}^{-}_3 $、$\rho({\mathrm{N}}\text{-}{{\mathrm{NH}}}_4^+ )$关系图
Figure 8. Relationships between $\delta^{15}{\mathrm{N}}\text{-}{\rm{NH}}_4^+ $ and $\delta^{15}{\mathrm{N}}\text{-}{\rm{NO}}^{ -}_3 $, ${\mathrm{N}}{\text -}{{\mathrm{NH}}}_4^+ $ concentration of soil in the study area
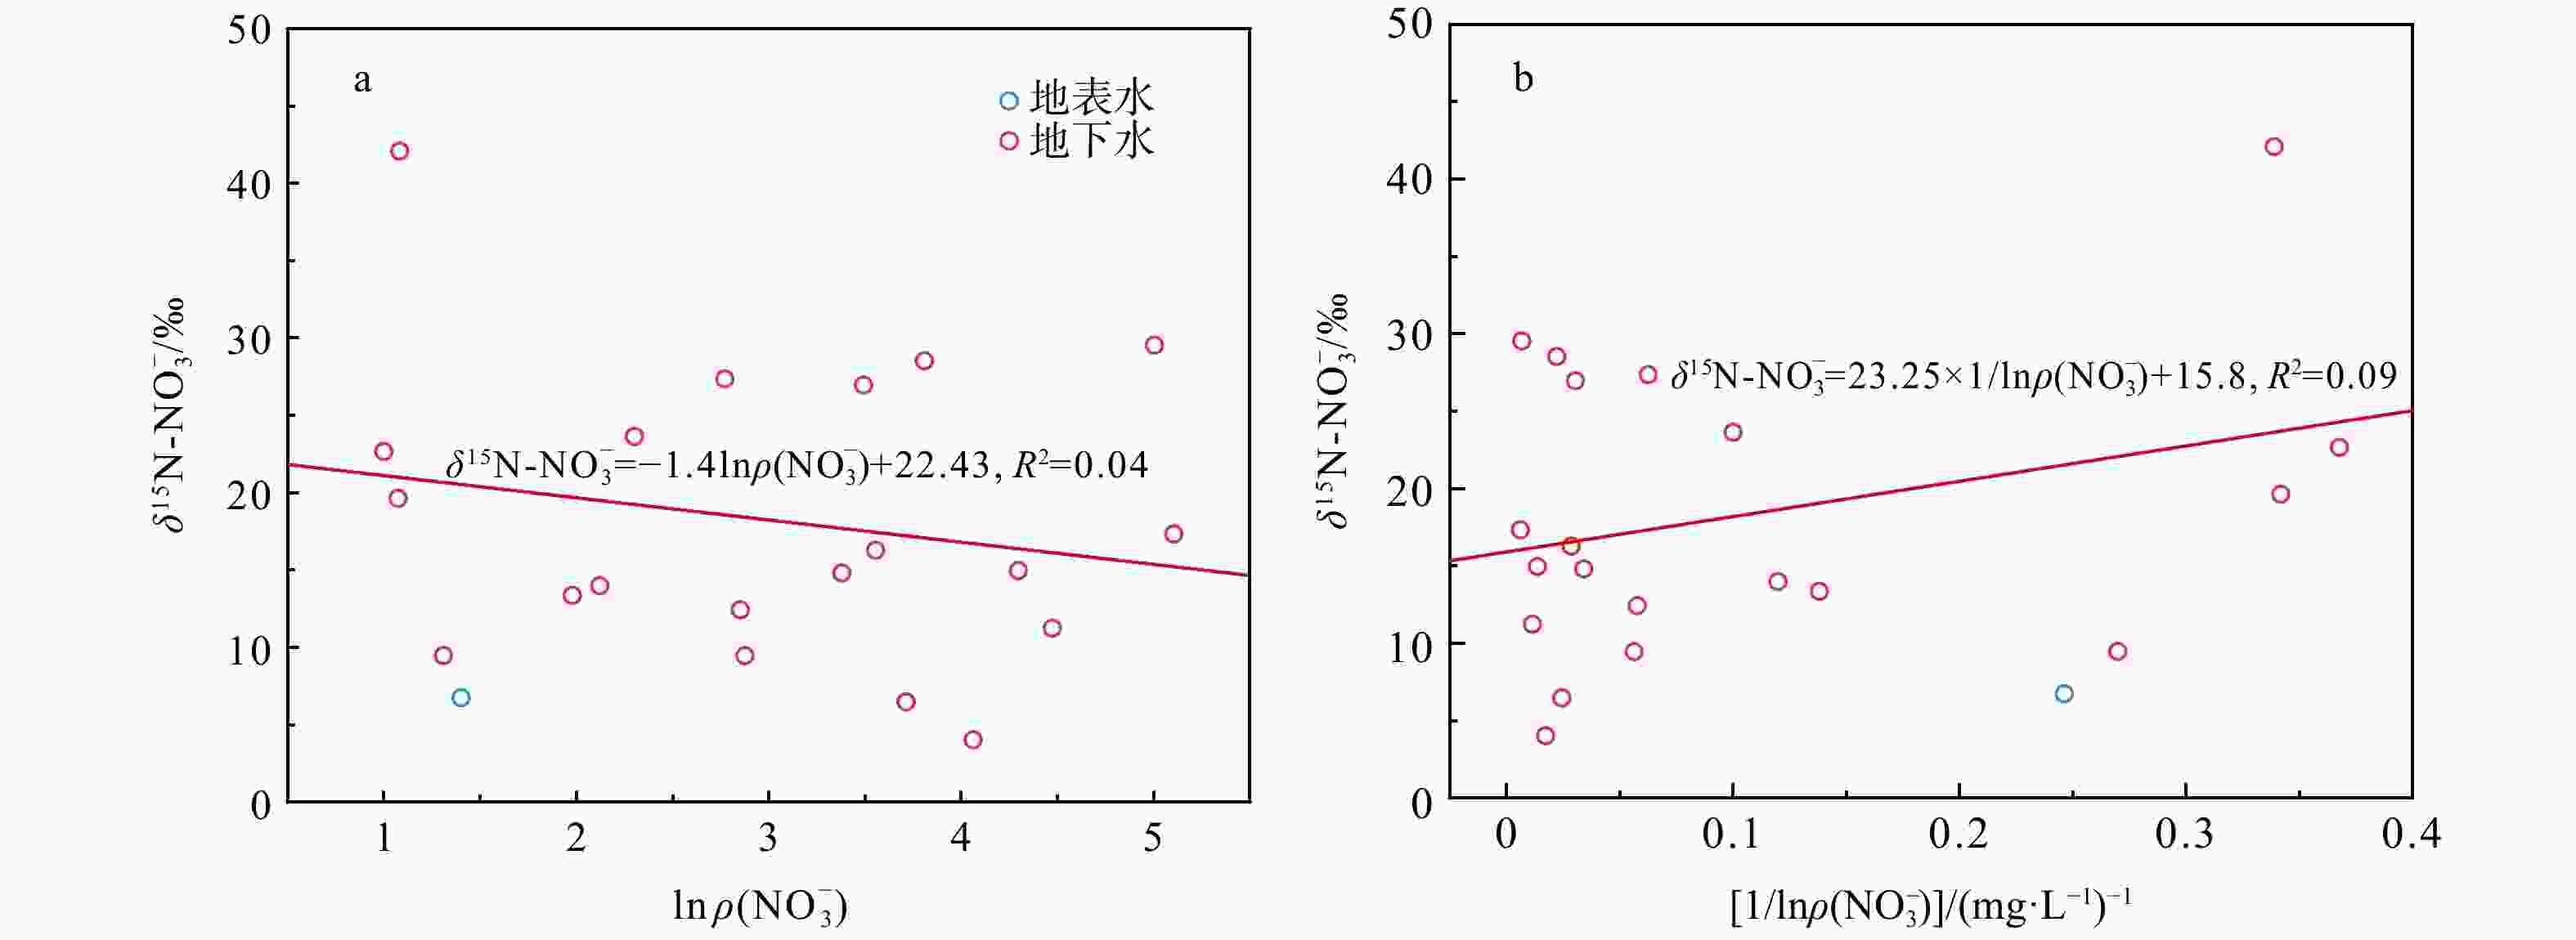
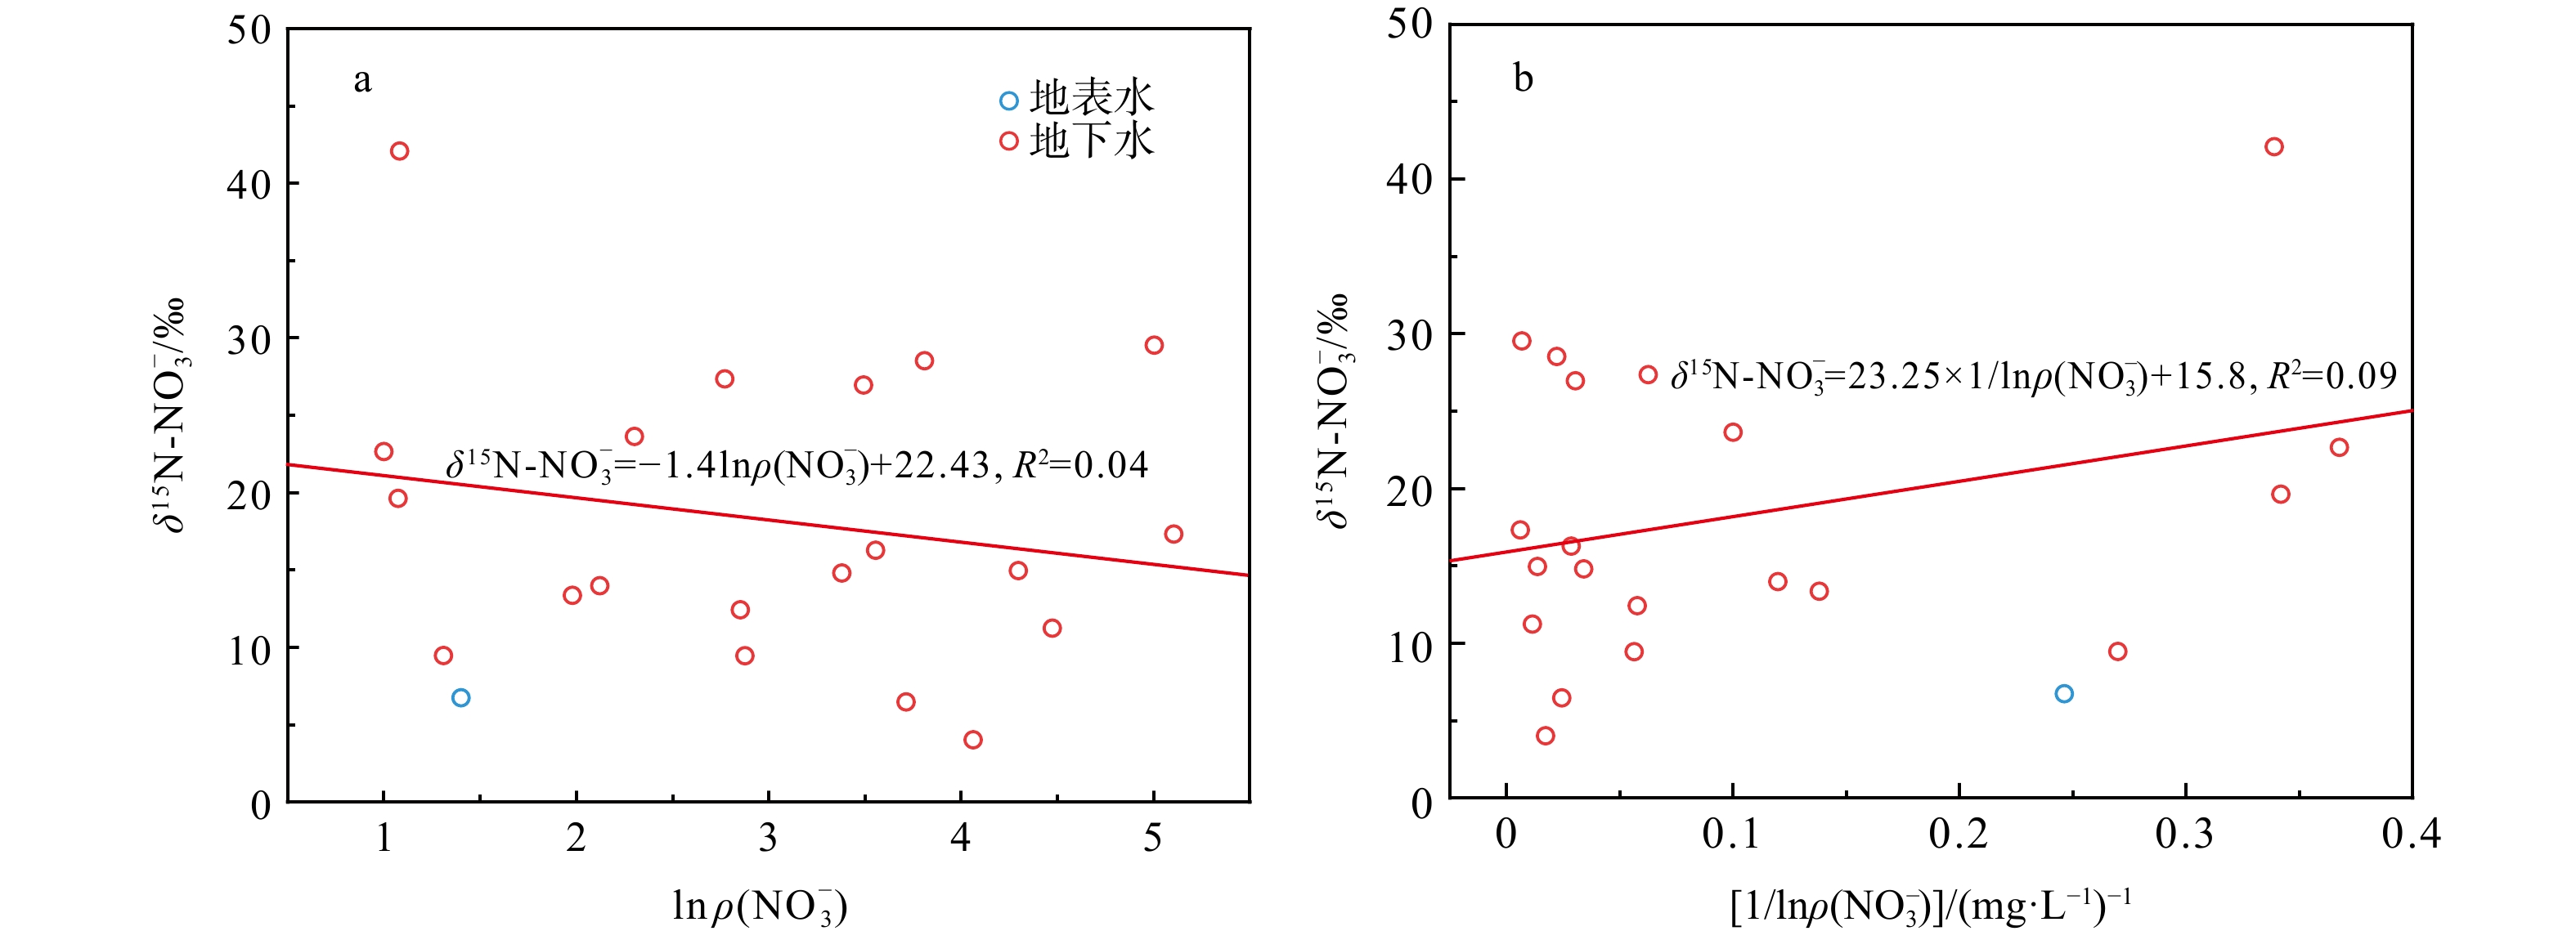
图 9 研究区水样$\delta {\mathrm{N}}^{15}{\text -}{\rm{NO}}^{-}_3 $与ln$\rho({\rm{NO}}^{-}_3 )$、1/${\mathrm{ln}}({\rm{NO}}^{-}_3 )$关系图
Figure 9. Plots of $\delta^{15}{\mathrm{N}}\text{-}{\rm{NO}}^{-}_3 $ versus ln (${\rm{NO}}^{-}_3 $), and $\delta^{15}{\mathrm{N}}\text{-}{\rm{NO}}^{-}_3 $ versus 1/ln(${\rm{NO}}^{-}_3 $) for water samples in the study area
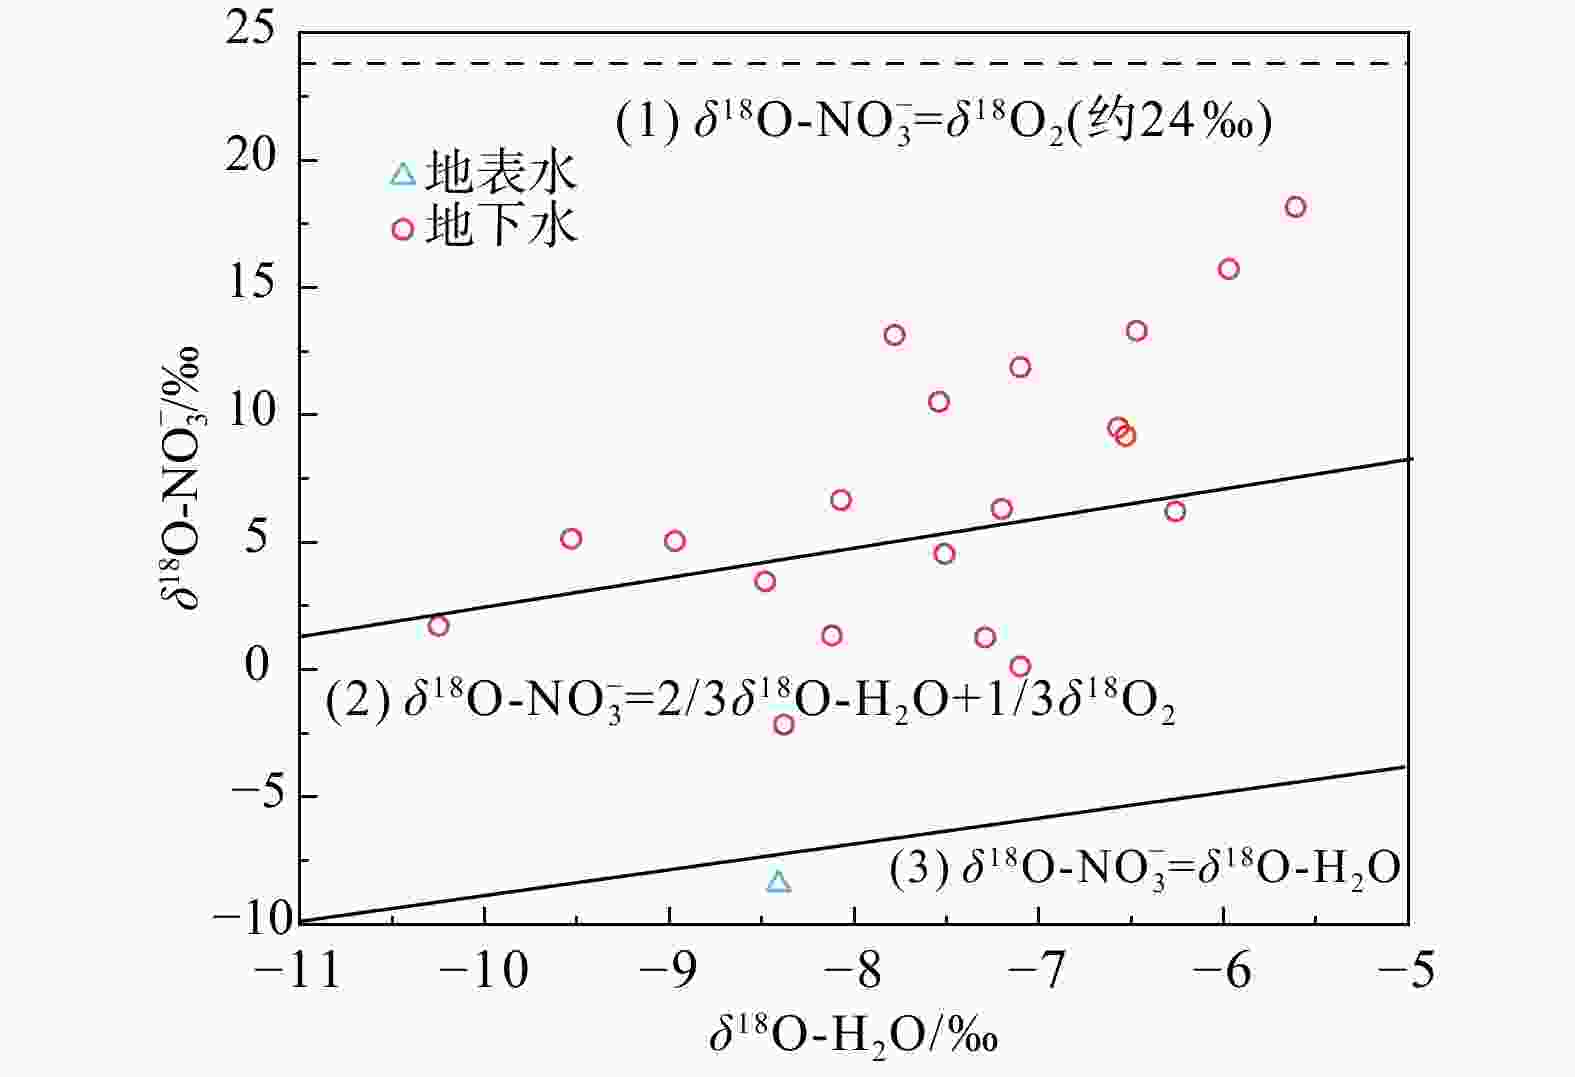
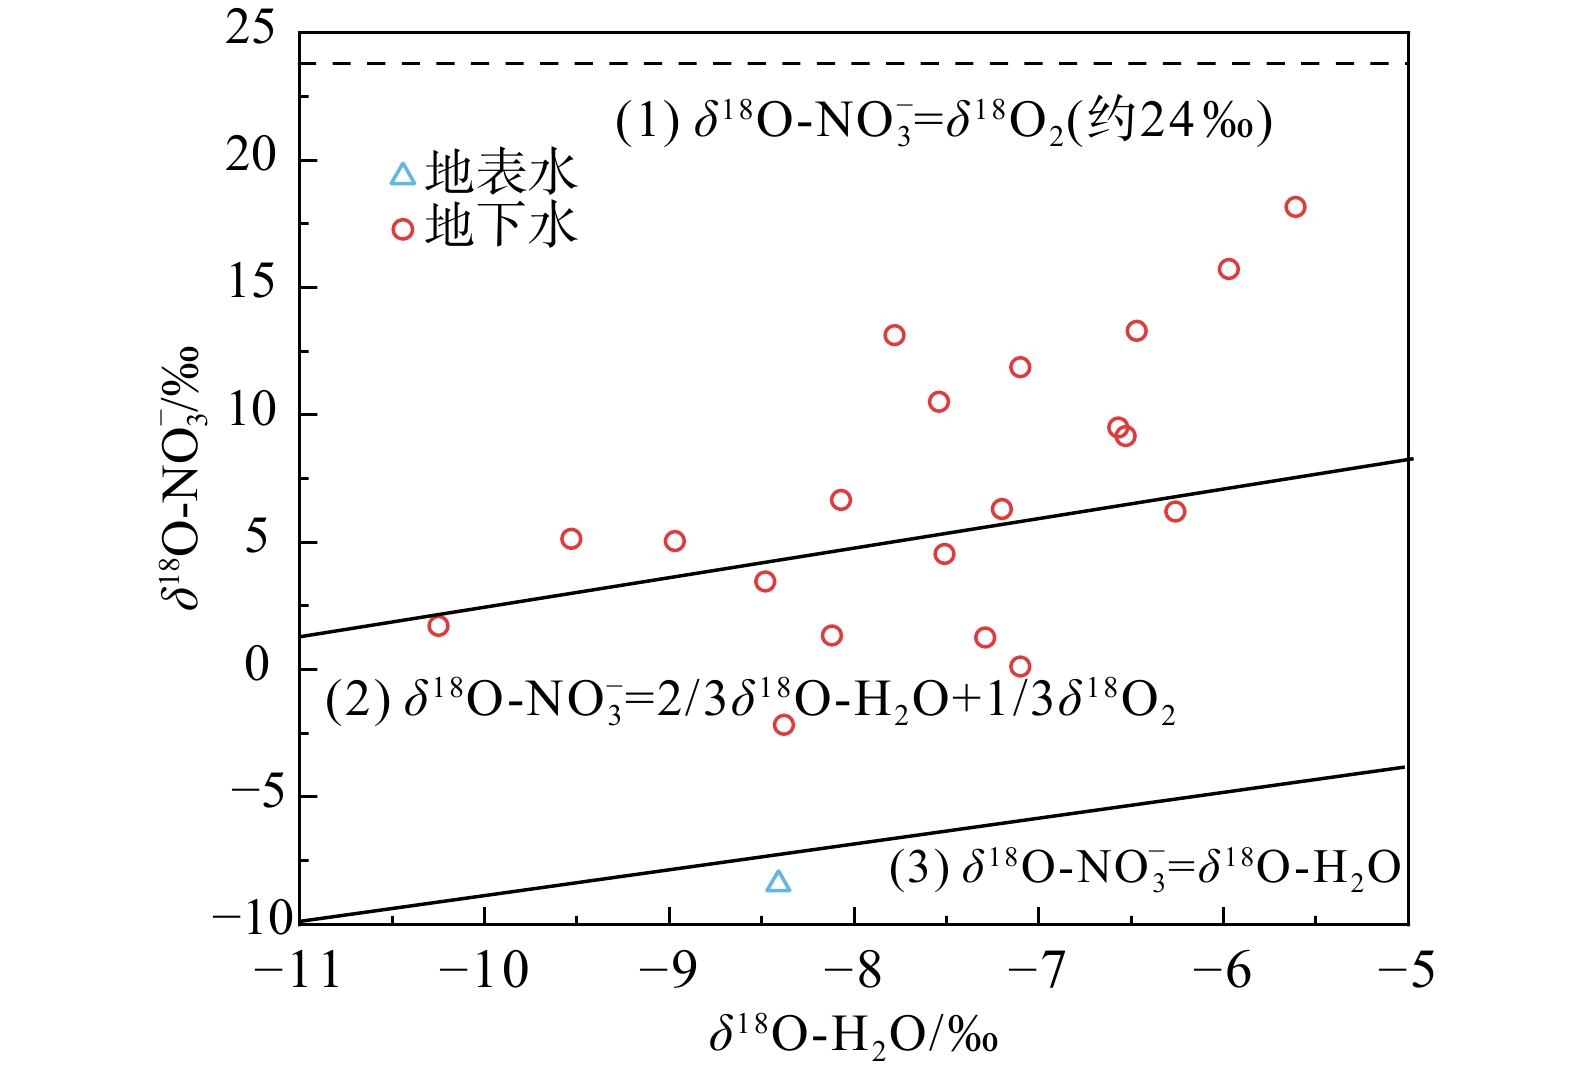
图 10 $\delta^{18}{\mathrm{O}}\text{-}{\rm{NO}}^{-}_3 $与δ18O-H2O关系图
Figure 10. Plot of $\delta^{18}{\mathrm{O}}\text{-}{\rm{NO}}^{-}_3 $ versus δ18O-H2O
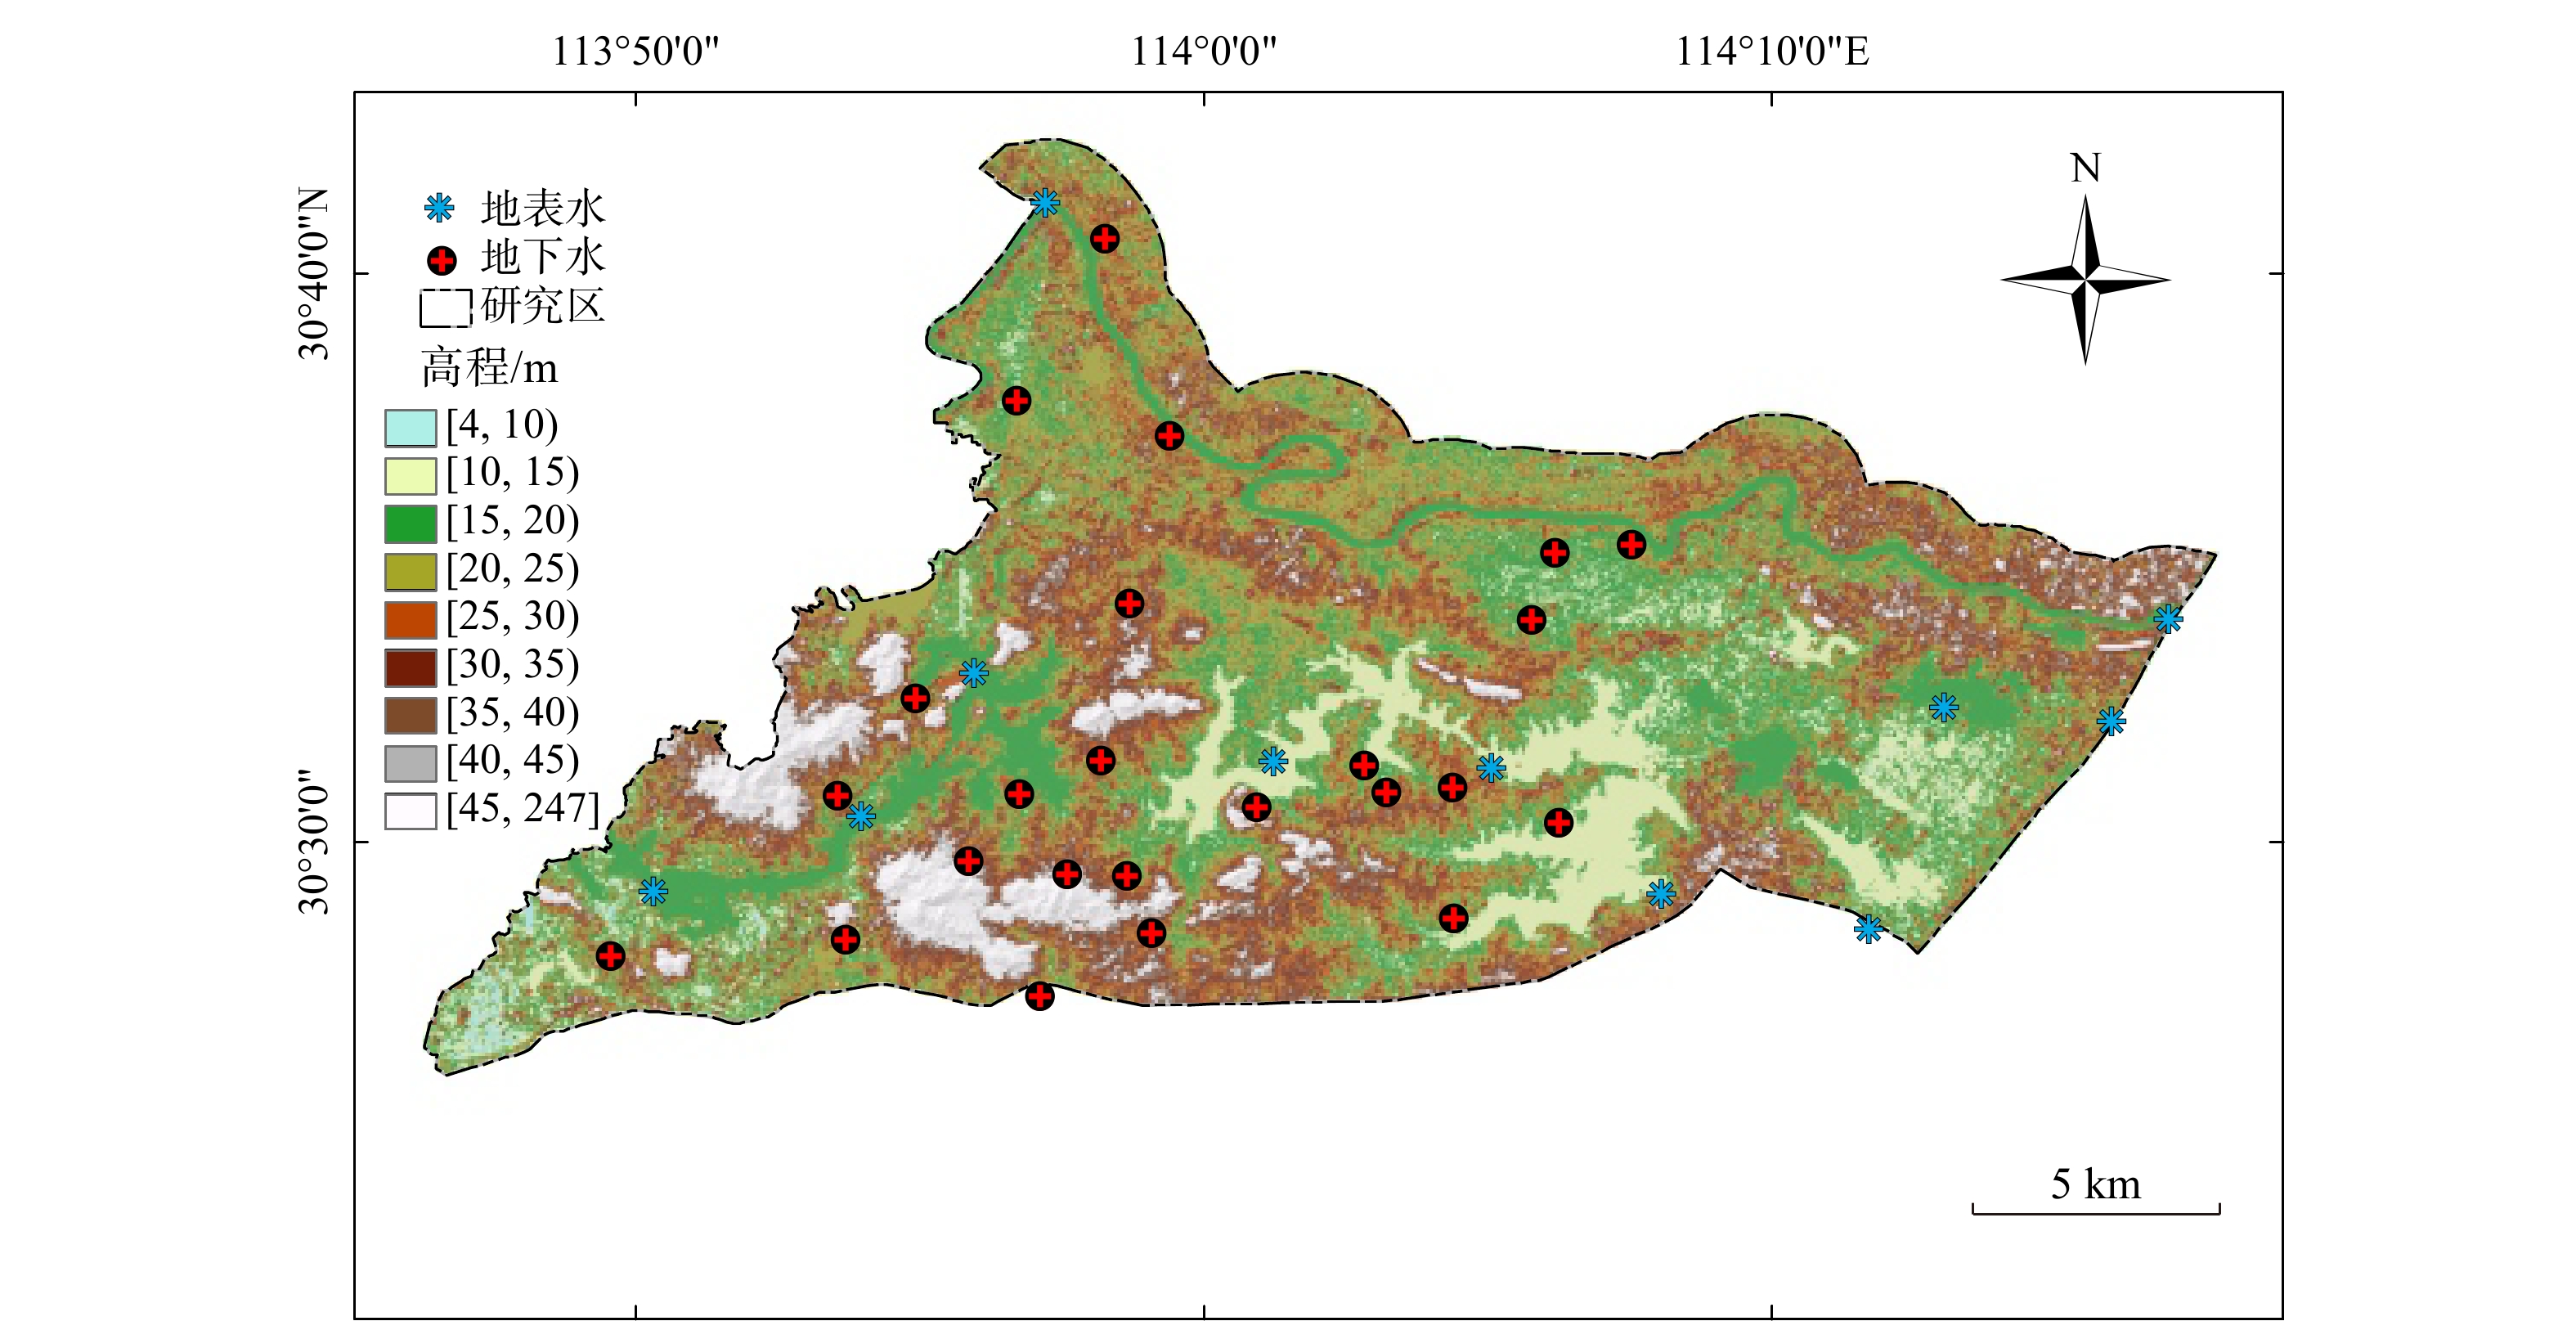
表 1 研究区地下水采样记录
Table 1. Groundwater sampling records in the study area
编号 坐标 井深/m 采集深度/m 含水层类型 情况描述 X/(°) Y/(°) DSH01 113.9459 30.6301 20 6 承压水 居民用水 DSH02 113.9910 30.6200 11 9 承压水 居民家中自用井 DSH03 113.9163 30.5430 13 10 承压水 居民生活区 DSH04 114.1039 30.5856 25 10 承压水 采样点为大片蔬菜农田、居民区 DSH05 114.0973 30.5657 20 8 承压水 居民门前废弃井 DSH06 113.9526 30.4554 25 9 承压水 居民家中井水 DSH07 113.8269 30.4672 15 10 承压水 居民家中井水 DSH08 113.8958 30.4722 15 10 承压水 居民家用井水 DSH09 113.8932 30.5145 30 8 承压水 居民家中废弃井水 DSH10 113.9708 30.5245 20 7 承压水 居民家中饮用水井 DSH11 113.9791 30.5709 15 10 承压水 居民家用井水 DSH12 113.9856 30.4741 30 15 承压水 马家湾村村民水井 DSH13 114.0162 30.5108 15 5 承压水 黄虎村大金湾居民家用井 DSH14 114.0546 30.5152 10 5 承压水 大集村村民水井 DSH15 113.9320 30.4949 30 15 承压水 居民家中废弃井 DSH16 114.0480 30.5231 10 4 承压水 三房湾村村民水井 DSH17 113.9607 30.4913 15 10 承压水 居民家后菜园中水井 DSH18 113.9782 30.4908 25 13 承压水 农家乐院中水井 DSH19 114.0743 30.4782 10 5 承压水 居民厨房家中用水,可饮用 DSH20 114.1053 30.5065 10 4 承压水 居民家中井水 DSH21 113.9466 30.5146 13 9 承压水 居民家中废弃水井 DSH22 113.9719 30.6776 16 5 承压水 灌溉用井,水质较为浑浊 DSH23 114.1266 30.5879 20 10 承压水 灌溉农田用水 DSH24 114.0740 30.5165 10 5 承压水 居民家用井水,可饮用,较为清澈  下载: 导出CSV
表 2 研究区地表水/浅层地下水质指标监测结果
Table 2. Monitoring results of water quality indication for surface water/shallow groundwater in the study area
项目 地下水(n=24) 地表水(n=14) 最大值 最小值 平均值 中位数 最大值 最小值 平均值 中位数 Na+ ρB/(mg·L−1) 54.79 4.595 29.39 23.945 44.67 9.69 15.31 12.77 K+ 59.21 0.81 10.10 6.07 11.67 2.04 4.00 3.285 Ca2+ 256.30 3.49 54.92 49.79 85.78 36.55 54.65 56.51 Mg2+ 174.80 7.42 38.09 19.74 12.18 6.59 9.10 9.34 F− 0.86 0.24 0.45 0.43 0.99 0.28 0.44 0.39 ${\rm{NO}}^{-}_3 $ 164.80 0.76 33.79 16.66 6.31 0.74 3.52 3.78 Cl− 169.20 10.24 43.49 33.60 56.04 10.31 19.37 15.83 ${\rm{SO}}^{2-}_4 $ 131.20 4.86 62.19 59.94 87.03 18.16 38.00 36.65 ${\rm{HCO}}^{-}_3 $ 590.50 67.37 241.60 181.20 197.30 104.10 144.10 152.70 TDS 19.80 9.00 15.88 0.45 22.40 12.00 19.18 0.28 δ2H/‰ −33.45 −67.05 −47.77 −46.77 −28.68 −75.78 −48.78 −50.56 δ18O/‰ −5.21 −10.25 −7.43 −7.25 −2.74 −10.86 −6.36 −6.71 pH 8.17 6.94 7.74 7.43 8.98 7.66 8.36 8.37 EC/(µS·cm−1) 1374.0 191.1 679.7 666.5 574 197.7 354.8 364.0 注:TDS. 总溶解性固体;EC. 电导率
下载: 导出CSV
表 3 武汉市蔡甸区地下水、土壤硝酸盐氮来源贡献率
Table 3. Contribution rate of groundwater and soil nitrate nitrogen sources in Caidian District, Wuhan
贡献率/% 污水和粪便 土壤氮 氨肥 地下水 48.6 32.9 18.5 土壤 79.7 13.2 7.1
下载: 导出CSV
-
[1] JIN Z, WANG J, CHEN J, et al. Identifying the sources of nitrate in a small watershed using δ15N-δ18O isotopes of nitrate in the Kelan Reservoir, Guangxi, China[J]. Agriculture, Ecosystems & Environment, 2020, 29(7):106936. [2] DU Y, MA T, DENG Y, et al. Sources and fate of high levels of ammonium in surface water and shallow groundwater of the Jianghan Plain, Central China[J]. Environmental Science- Processes & Impacts, 2017, 19(2): 161-172. [3] GUTIERREZ M, BIAGIONI R N, ALARCON-HERRERA M T, et al. An overview of nitrate sources and operating processes in arid and semiarid aquifer systems[J]. Science of the Total Environment, 2018, 624: 1513-1522. [4] 冷智超, 杜尧, 陶艳秋, 等. 长江中游沿岸地下水中铵氮与磷的共存规律及其控制因素[J]. 地质科技通报, 2022, 41(1): 300-308.LEN Z C, DU Y, TAO Y Q, et al. Coexistence of ammonium, nitrogen and phosphorus in groundwater along the middle reaches of the Yangtze River and its controlling factors[J]. Bulletin of Geological Science and Technology, 2022, 41(1): 300-308. (in Chinese with English abstract [5] 魏守才, 刘京涛, 夏江宝,等. 基于氮氧同位素示踪的滨州市水体硝酸盐污染来源解析[J]. 北京师范大学学报(自然科学版), 2021, 57(1): 29-35.WEI S C, LIU J T, XIA J B, et al. Analysis of nitrate pollution sources in water bodies in Binzhou City based on nitrogen and oxygen isotope tracing[J]. Journal of Beijing Normal University (Natural Science Edition) , 2021, 57(1): 29-35. (in Chinese with English abstract [6] 傅雪梅, 孙源媛, 苏婧, 等. 基于水化学和氮氧双同位素的地下水硝酸盐源解析[J]. 中国环境科学, 2019, 39(9): 3951-3958.FU X M, SUN Y Y, SU Q, et al. Analysis of groundwater nitrate sources based on water chemistry and nitrogen-oxygen biisotopes[J]. Environmental Science in China, 2019, 39(9): 3951-3958. (in Chinese with English abstract [7] 崔玉环, 王杰, 郝泷,等. 长江中下游平原升金湖流域硝酸盐来源解析及其不确定性[J]. 湖泊科学, 2021, 33(2): 474-482.CUI Y H, WANG J, HAO L, et al. Analysis of nitrate sources and their uncertainty in the Shengjin Lake Basin of the middle and lower reaches of the Yangtze River[J]. Lake Science, 2021, 33(2): 474-482. (in Chinese with English abstract [8] SOTO D X, KOEHLER G, WASSENAAR L I, et al. Spatio-temporal variation of nitrate sources to Lake Winnipeg using N and O isotope (delta(15)N, delta(18)O) analyses[J]. Science of the Total Environment, 2019, 647: 486-493. [9] POPESCU R, MIMMO T, DINCA O R, et al. Using stable isotopes in tracing contaminant sources in an industrial area: A case study on the hydrological basin of the Olt River, Romania[J]. Science of the Total environment, 2015, 533: 17-23. [10] NIKOLENKO O, JURADO A, BORGES A V, et al. Isotopic composition of nitrogen species in groundwater under agricultural areas: A review[J]. Science of the Total environment, 2018, 621: 1415-1432. [11] ZHANG Y, SHI P, SONG J, et al. Application of nitrogen and oxygen isotopes for source and fate identification of nitrate pollution in surface water: A review[J]. Applied Sciences, 2018, 9(1):18-27. [12] PHILLIPS D L, KOCH P L. Incorporating concentration dependence in stable isotope mixing models[J]. Oecologia, 2002, 130(1): 114-125. [13] ZHENG L, JIANG C, CHEN X, et al. Combining hydrochemistry and hydrogen and oxygen stable isotopes to reveal the influence of human activities on surface water quality in Chaohu Lake Basin[J]. Journal of Environmental Management, 2022, 312: 114933. [14] 彭红明, 袁有靖, 李铜邦, 等. 青海天峻新关角隧道涌排水水源识别与量化分析[J]. 地质科技通报, 2022, 41(1): 60-70.PENG H M, YUAN Y J, LI T B, et al. Identification and quantitative analysis of water source of inrush drainage in Xinguanjiao Tunnel in Tianjun, Qinghai[J]. Bulletin of Geological Science and Technology, 2022, 41(1): 60-70. (in Chinese with English abstract [15] TORRES-MARTINEZ J A, MORA A, KNAPPETT P S K, et al. Tracking nitrate and sulfate sources in groundwater of an urbanized valley using a multi-tracer approach combined with a Bayesian isotope mixing model[J]. Water Research, 2020, 182: 115962. [16] MINET E P, GOODHUE R, MEIER-AUGENSTEIN W, et al. Combining stable isotopes with contamination indicators: A method for improved investigation of nitrate sources and dynamics in aquifers with mixed nitrogen inputs[J]. Water Research, 2017, 124: 85-96. [17] DING J, XI B, XU Q, et al. Isotopic evidence of nitrate sources and its transformations in a human-impacted watershed[J]. Environmental Science (Processes & Impacts), 2019, 21(3): 575-583. [18] ANDERSON T R, GROFFMAN P M, KAUSHAL S S, et al. Shallow groundwater denitrification in riparian zones of a headwater agricultural landscape[J]. Journal of Environmental Quality, 2014, 43(2): 732-744. [19] XUE Y, SONG J, ZHANG Y, et al. Nitrate pollution and preliminary source identification of surface water in a Semi-Arid River Basin, using isotopic and hydrochemical approaches[J]. Water Research, 2016, 8(8): 936-947. [20] JIN Z, PAN Z, JIN M, et al. Determination of nitrate contamination sources using isotopic and chemical indicators in an agricultural region in China[J]. Agriculture, Ecosystems & Environment, 2012, 155: 78-86. [21] WANG W, SONG X, MA Y. Identification of nitrate source using isotopic and geochemical data in the lower reaches of the Yellow River irrigation district (China)[J]. Environmental Earth Sciences, 2016, 75(11): 967-979. [22] JIN Z, ZHENG Q, ZHU C, et al. Contribution of nitrate sources in surface water in multiple land use areas by combining isotopes and a Bayesian isotope mixing model[J]. Applied Geochemistry, 2018, 93: 10-19. [23] FEIGIN A, SHEARER G, KOHL D H, et al. The amount and nitrogen‐15 content of nitrate in soil profiles from two central Illinois fields in a Corn-Soybean Rotation[J]. Soil Science Society of America Journal, 1974, 38(3): 465-471. [24] KARR J D, SHOWERS W J, GILLIAM J W, et al. Tracing nitrate transport and environmental impact from intensive swine farming using delta nitrogen-15[J]. Journal of Environmental Quallity, 2001, 30(4): 1163-1175. [25] BARNES R T, RAYMOND P A. Land-use controls on sources and processing of nitrate in small watersheds: insights from dual isotopic analysis[J]. Ecological Applications, 2010, 20(7): 1961-1978. [26] 李扬, 康桂玲, 胡尊芳, 等. 聊城市城郊浅层地下水硝酸盐污染源解析[J]. 水文, 2020, 40(5): 91-96.Li Y, Kang G L, Hu Z F, et al. Analysis of nitrate pollution sources of shallow groundwater on the outskirts of Liaocheng City[J]. Hydrology, 2020, 40(5): 91-96. (in Chinese with English abstract [27] 李冬丽, 贺海波. 西南喀斯特地区水体硝态氮时空分布特征及其来源解析[J]. 地球化学, 2022, 51(1): 34-45.Li D L, He H B. Spatial-temporal distribution characteristics of nitrate nitrogen in water in southwest karst region and analysis of its source[J]. Geochemistry, 2022, 51(1): 34-45. (in Chinese with English abstract -

 下载:
下载:


 点击查看大图
计量
- 文章访问数: 444
- PDF下载量: 63
- 被引次数: 0

