| Citation: | LI Zihao,JIANG Shu. Reconstructing and interpreting analysis of sonic logging curves based on machine learning and SHAP algorithm[J]. Bulletin of Geological Science and Technology,2025,44(1):321-331 doi: 10.19509/j.cnki.dzkq.tb20230504

|
Well logging techniques is cruicial for determining subsurface lithological characteristics and geological structures, which plays a pivotal role in the petroleum exploration industry. However, issues such as instrument damage and wellbore conditions frequently lead to data gapping or incomplete curves of well logs. Traditional multivariate linear regression or empirical formula fail to construct a reasonable relationship model among well logging curves, resulting in a relatively low reconstruction accuracy. Although machine learning algorithms are able to find the most appropriate mapping relationship between a large amount of data to improve the model accuracy, the black-box characteristics cannot be well explained.
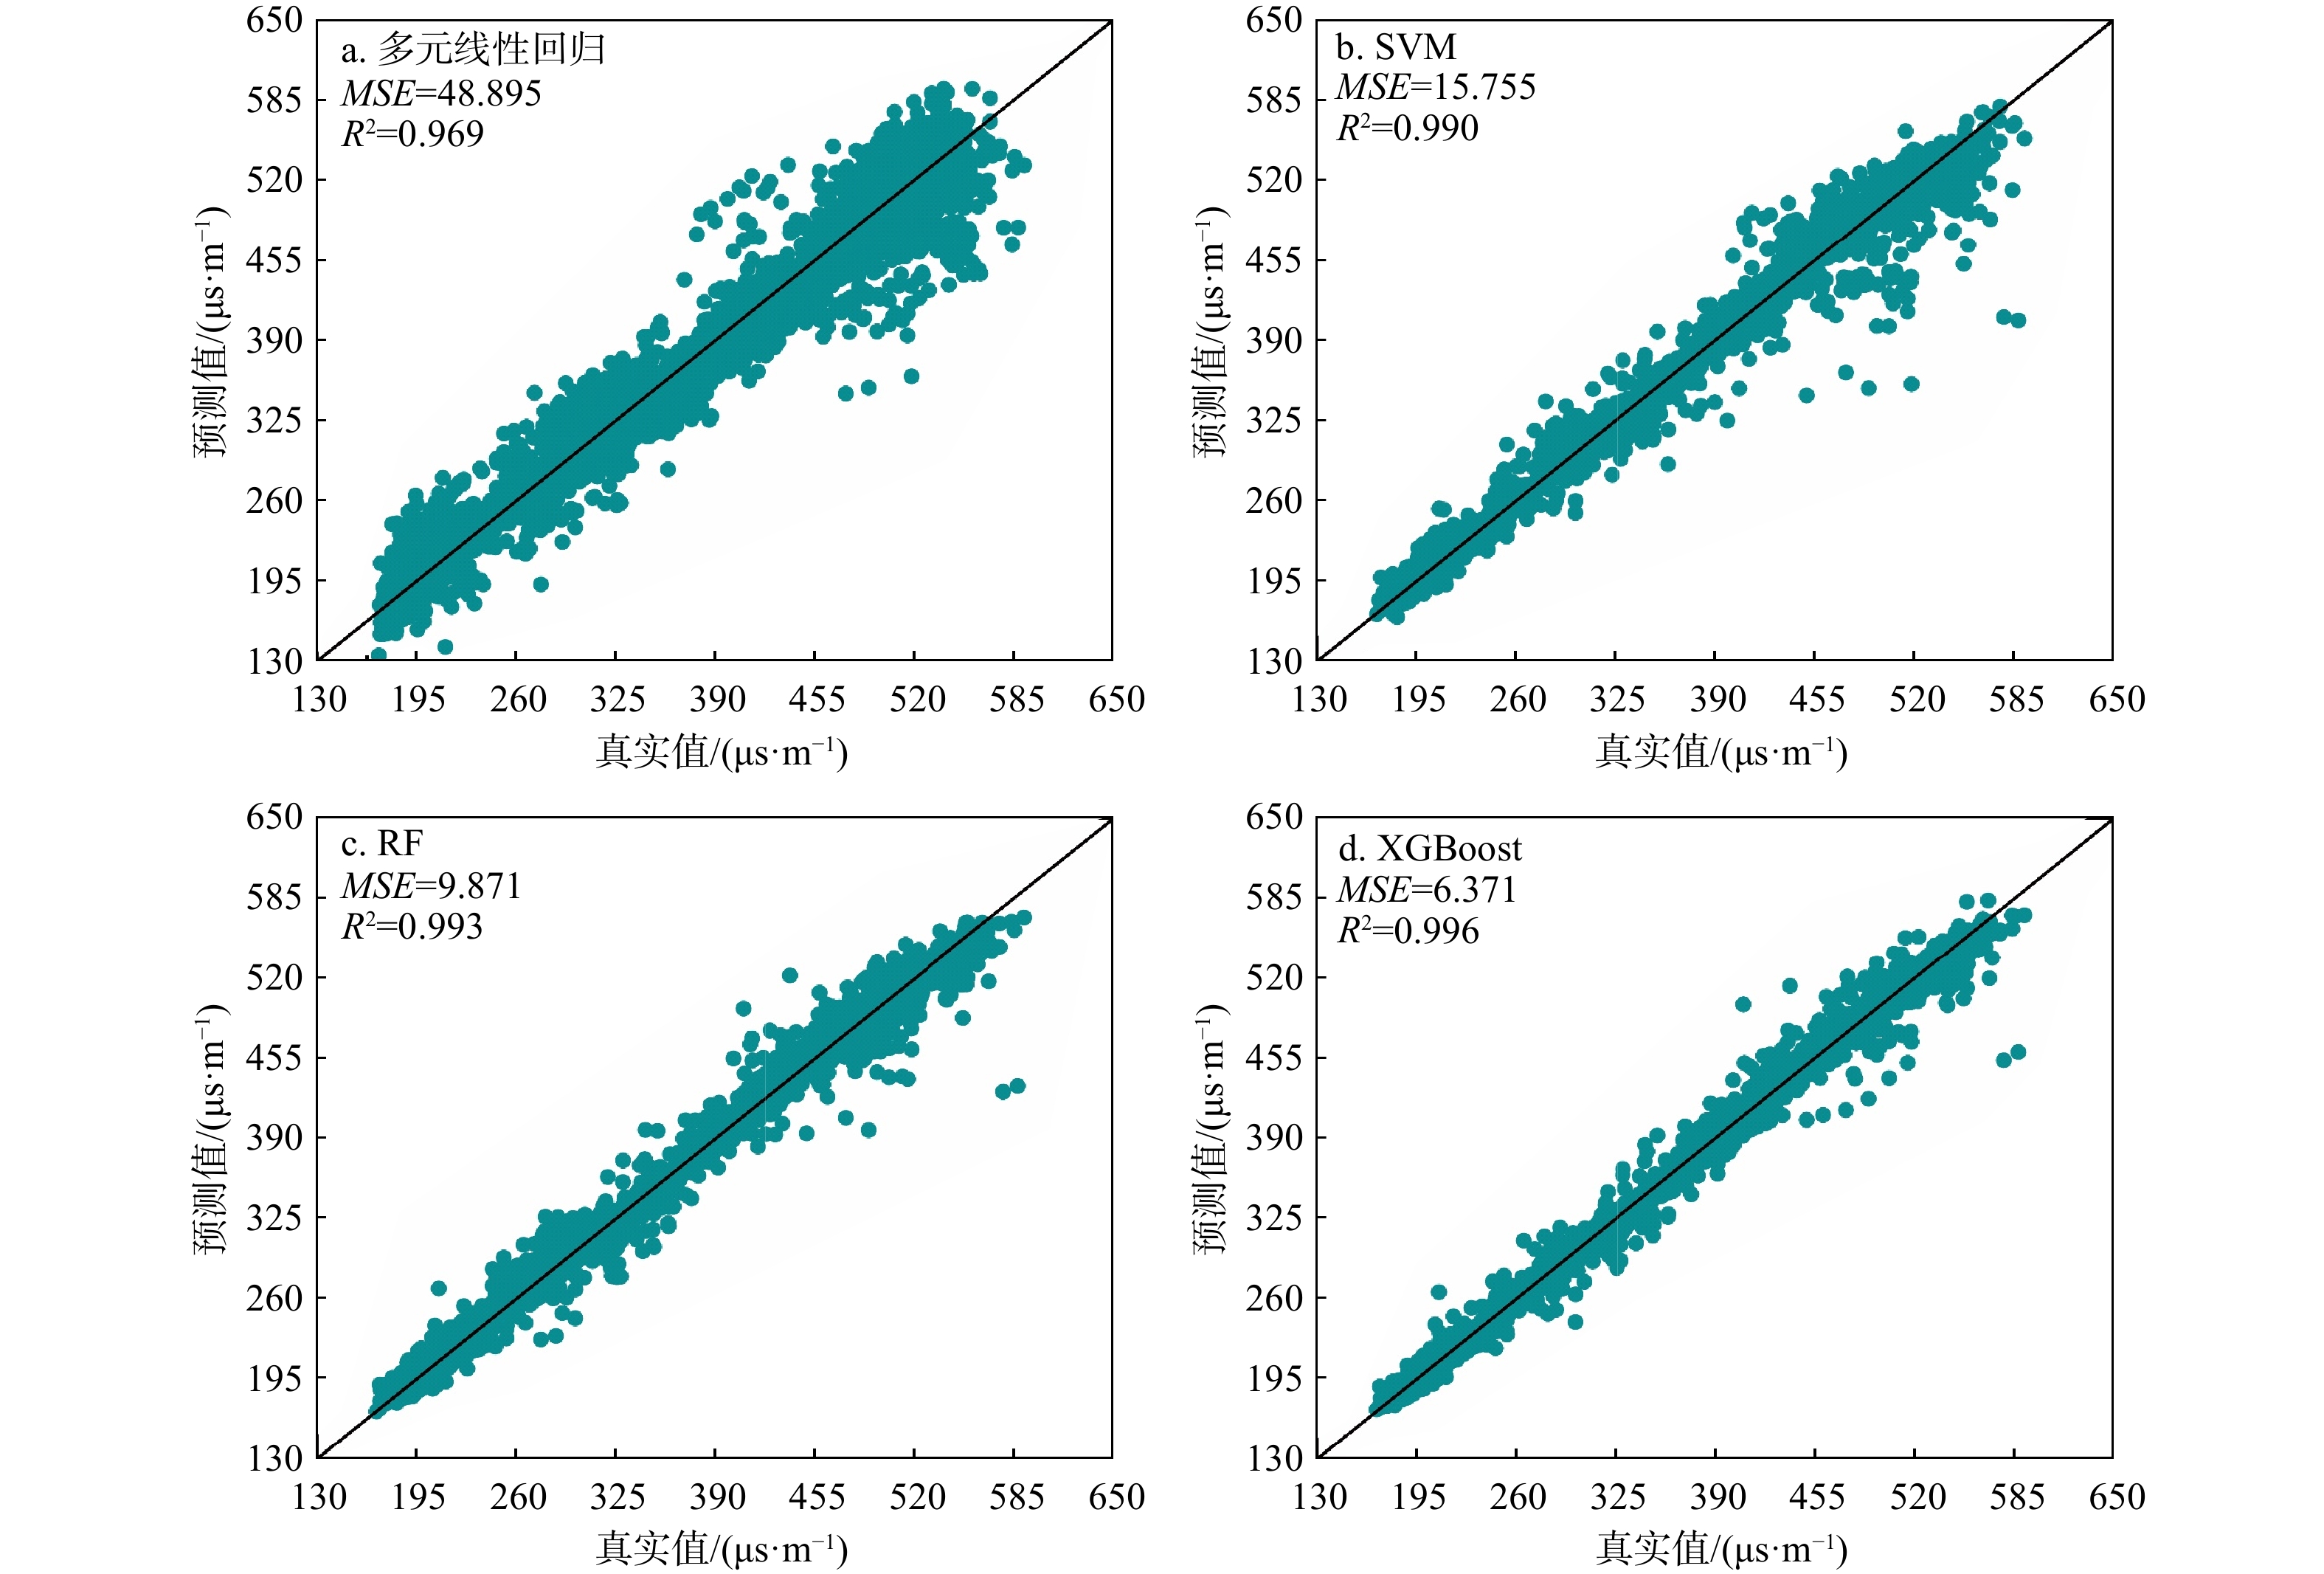
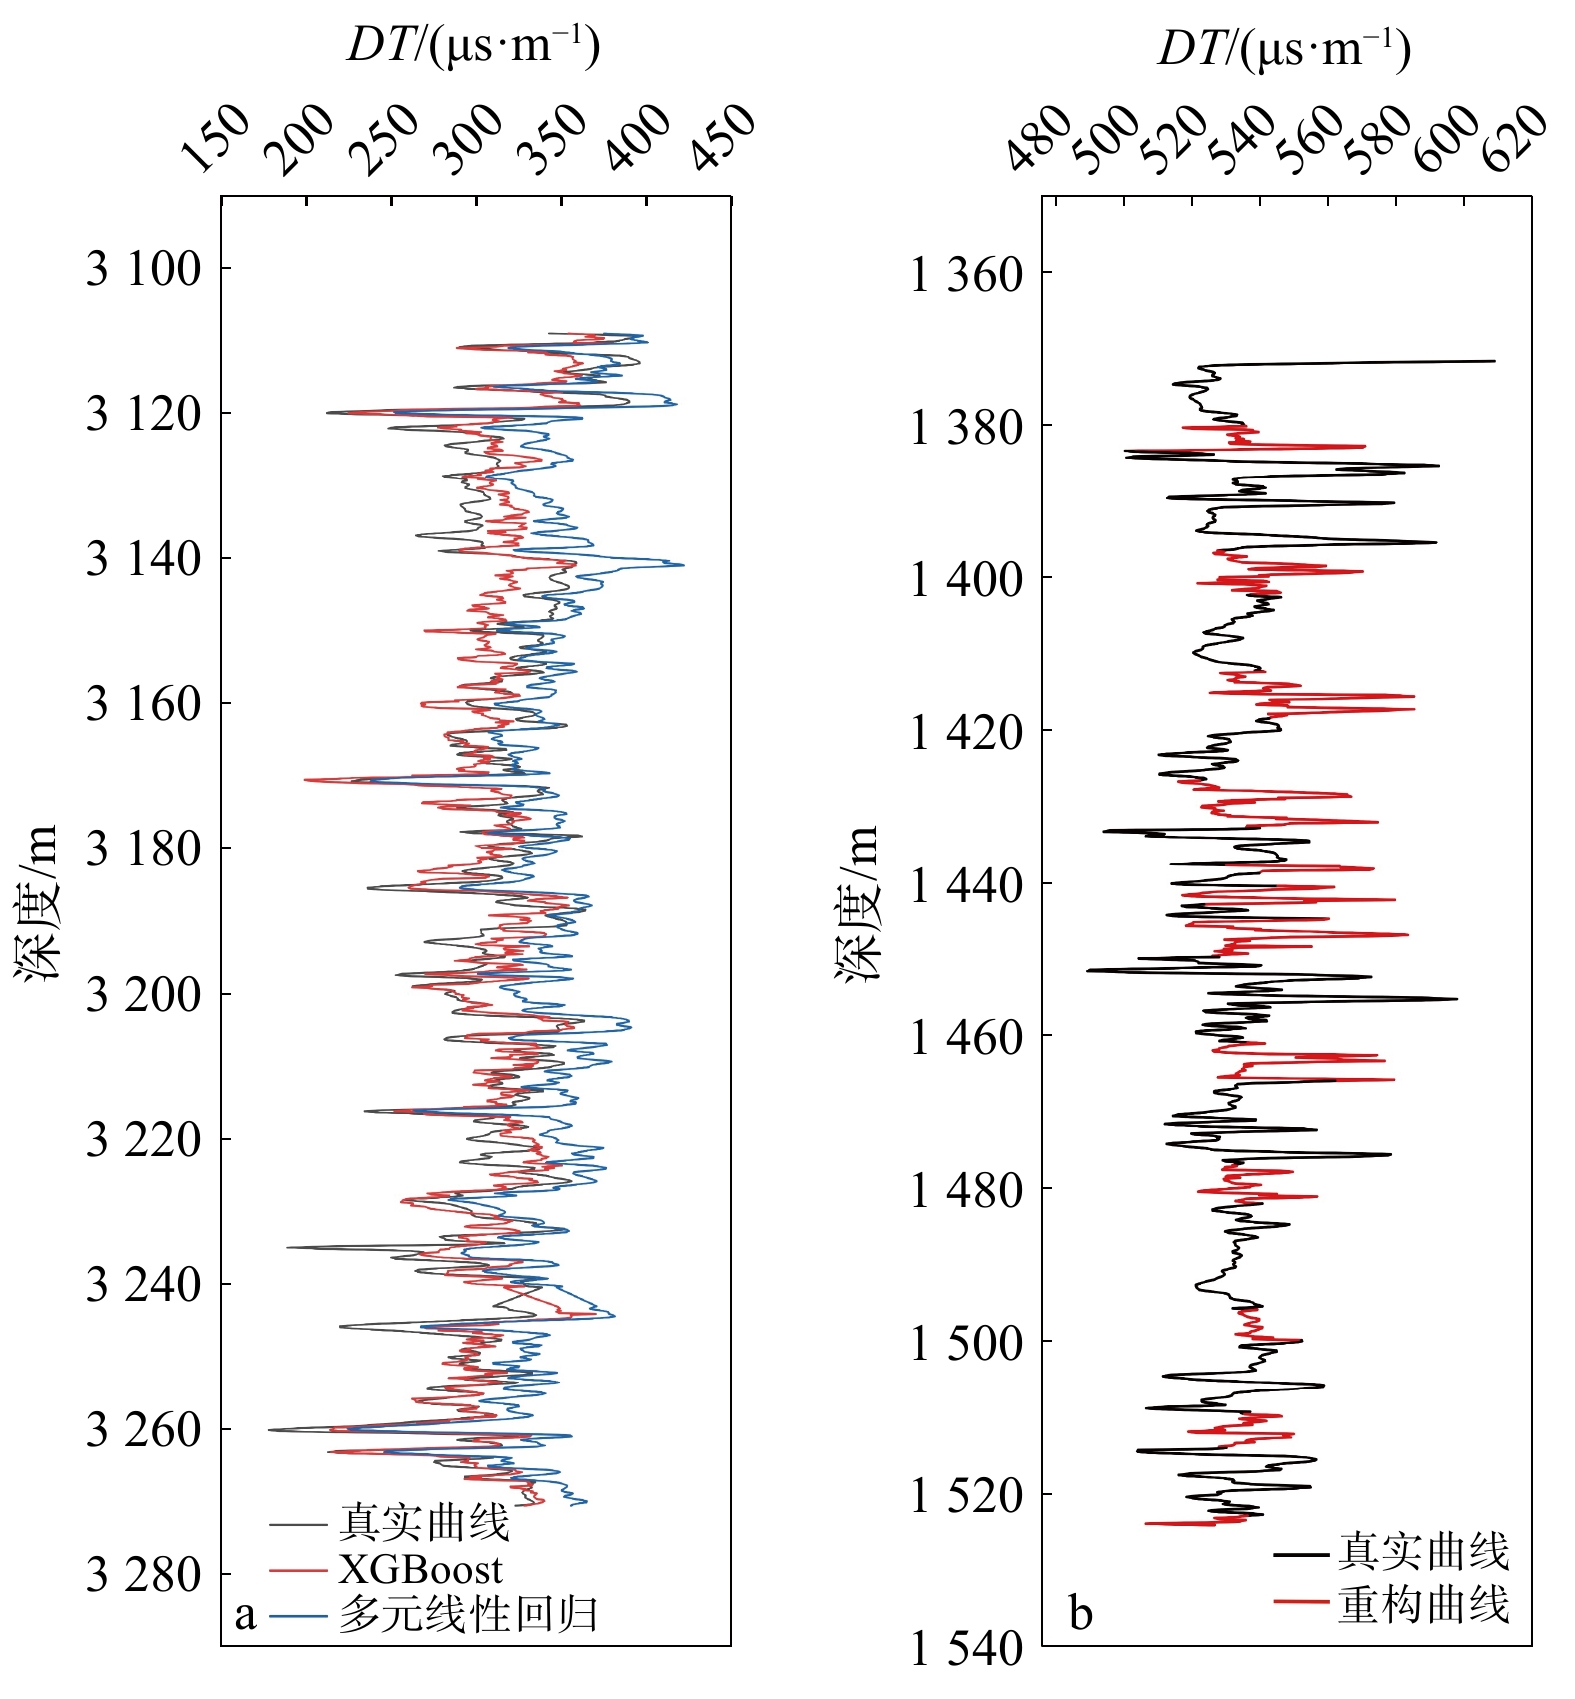
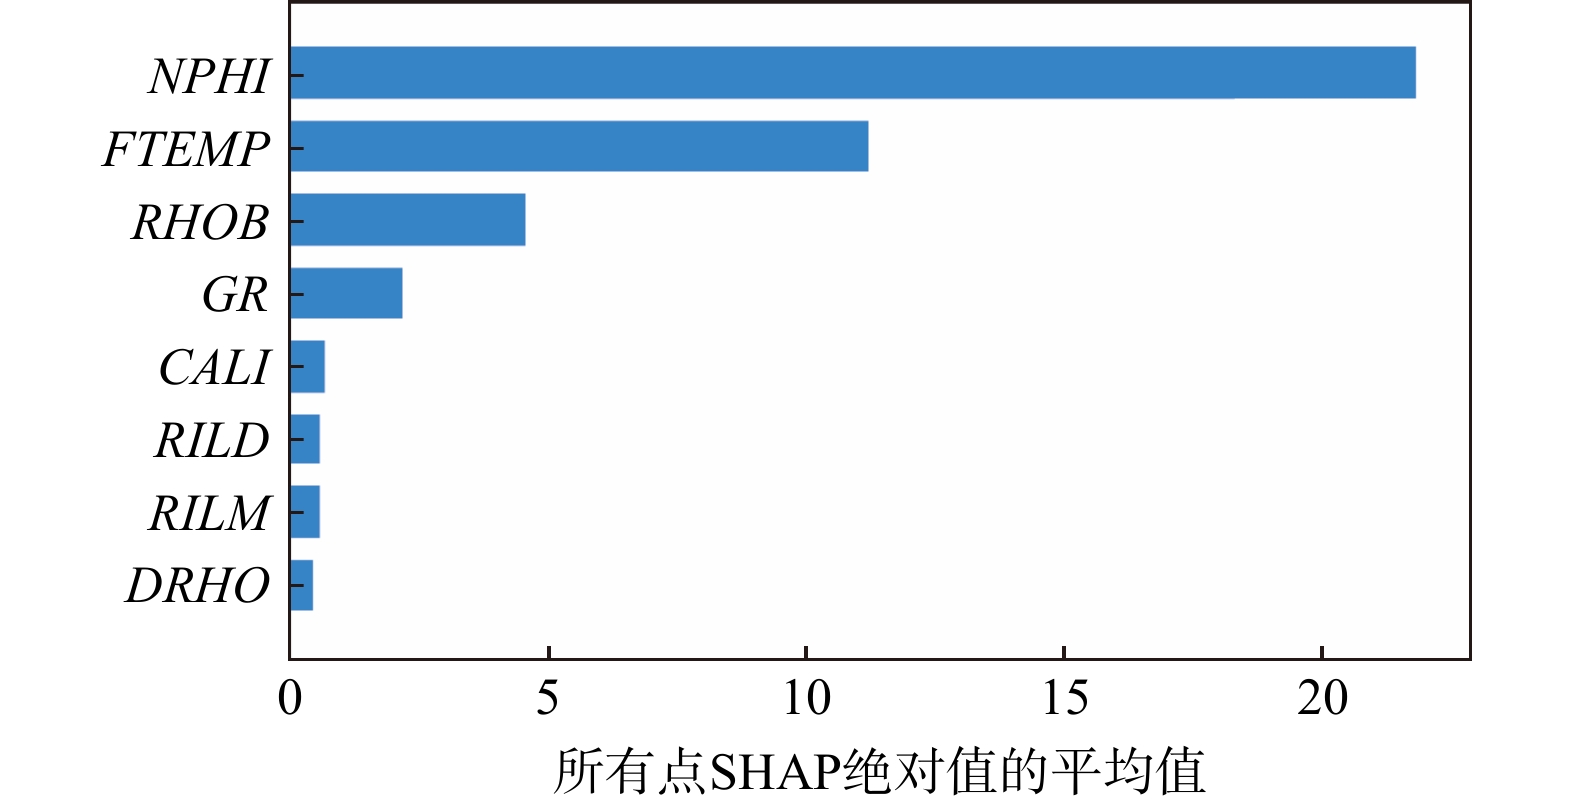
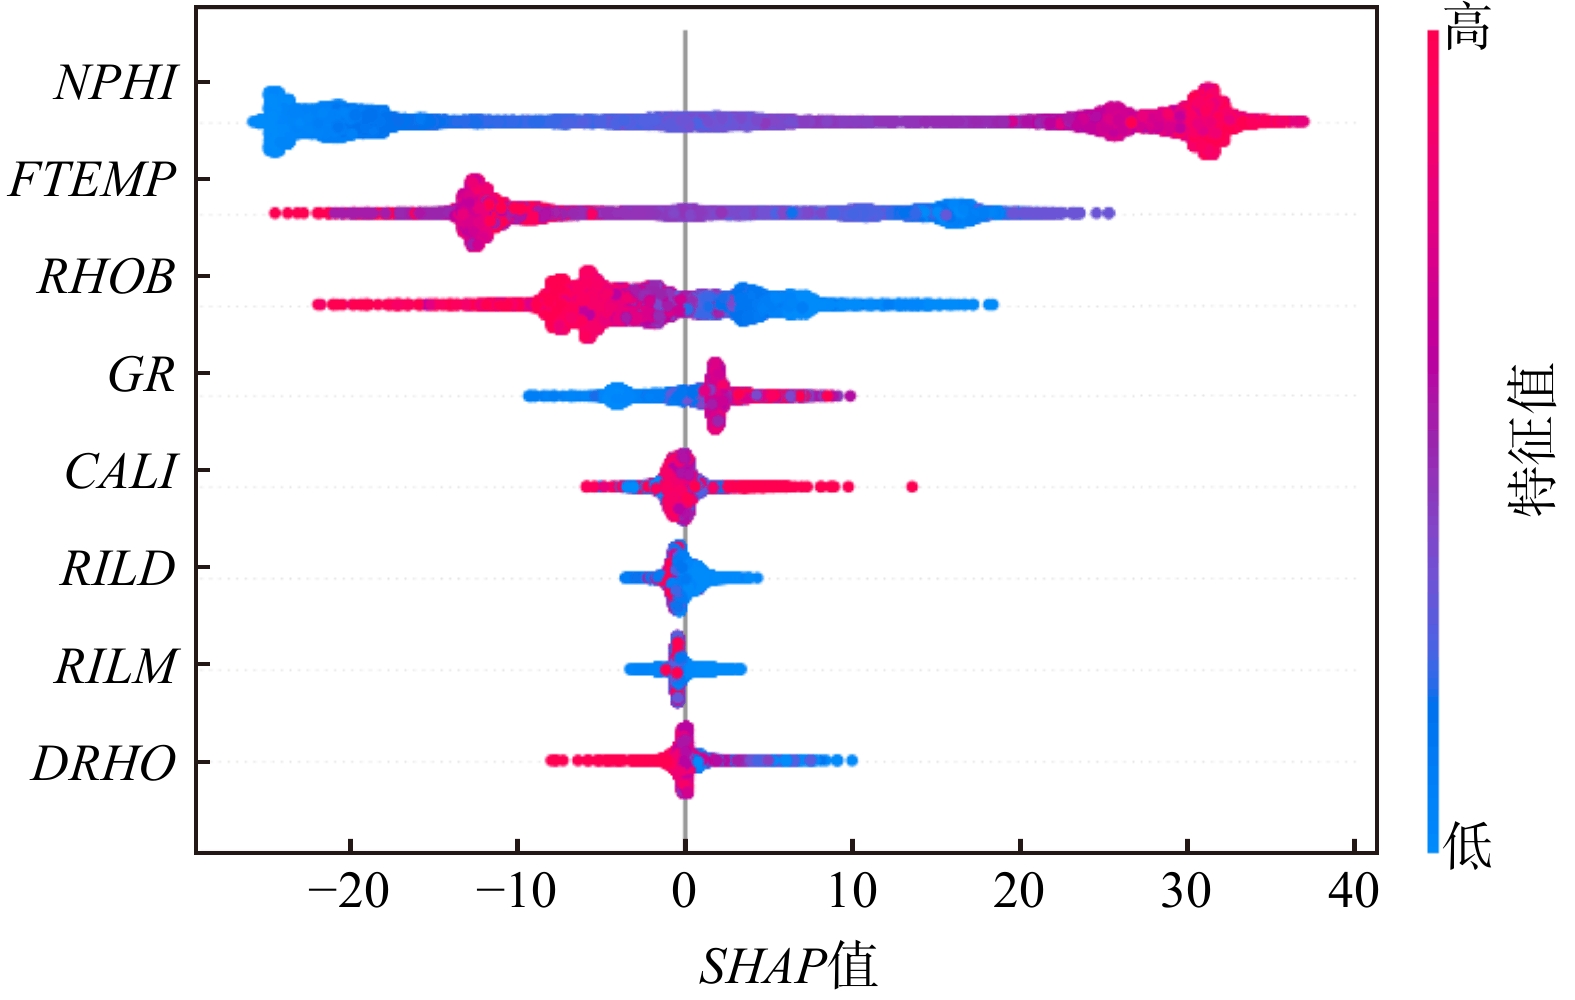
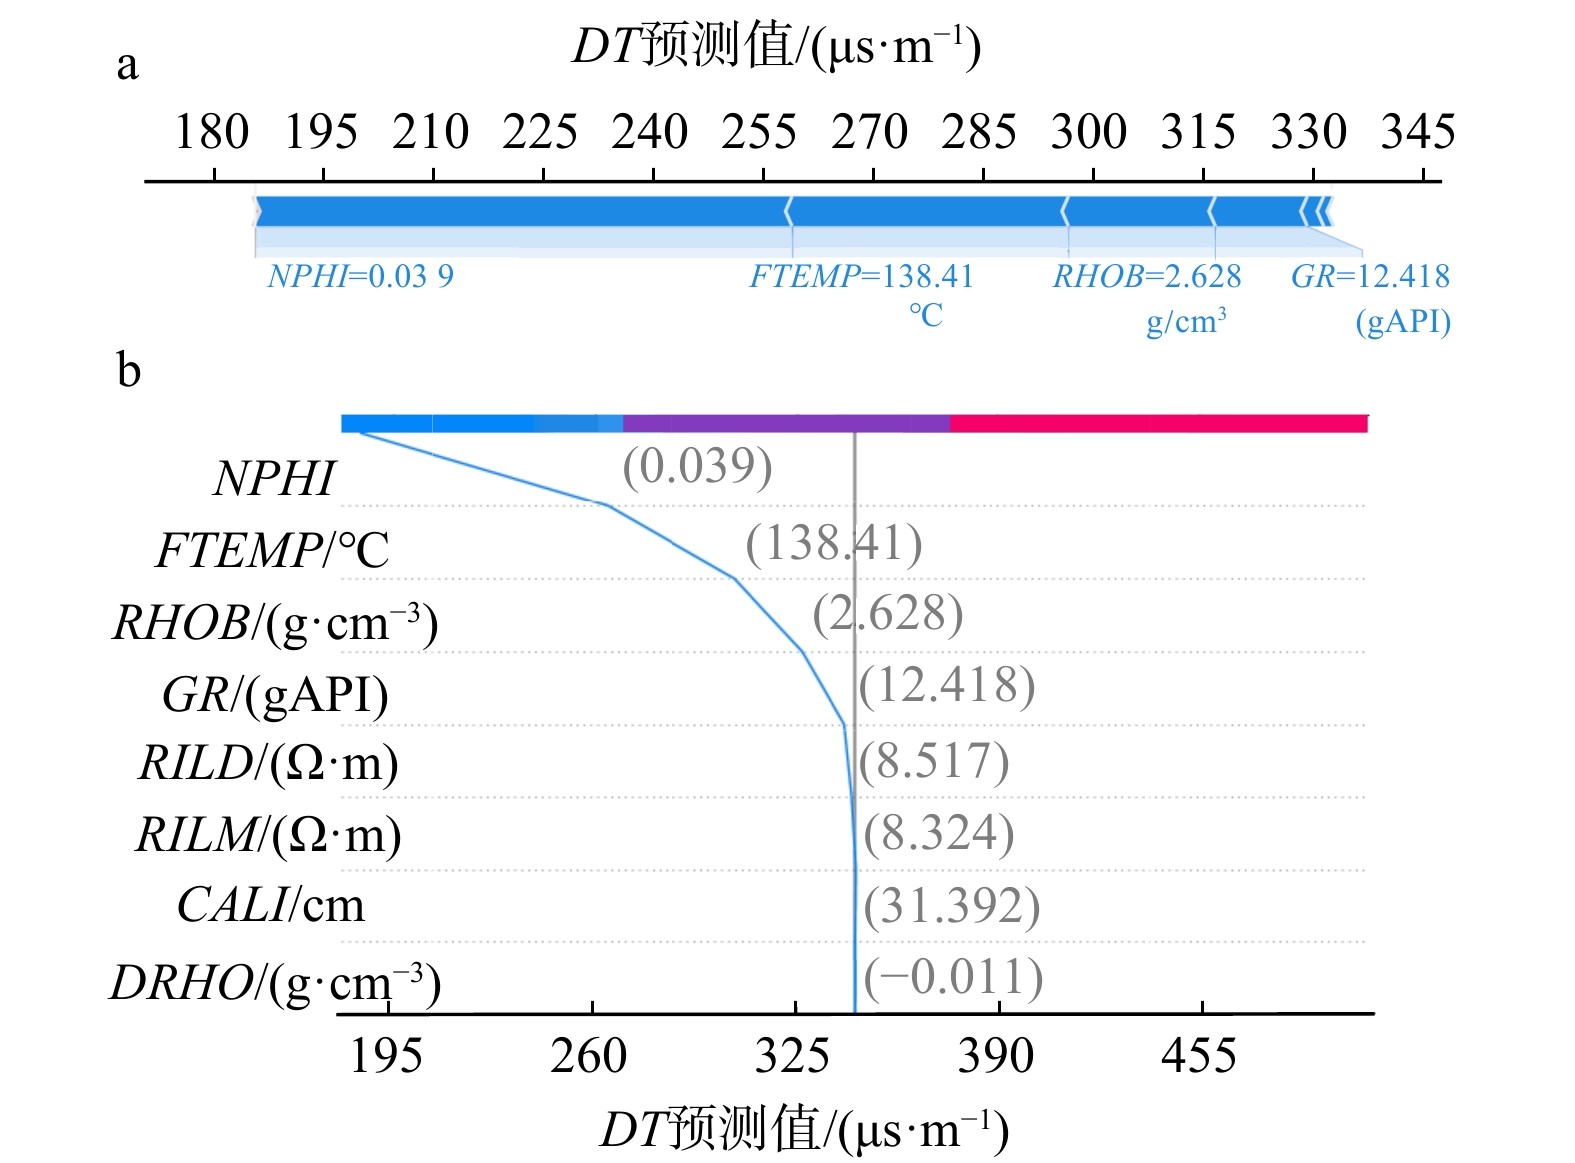
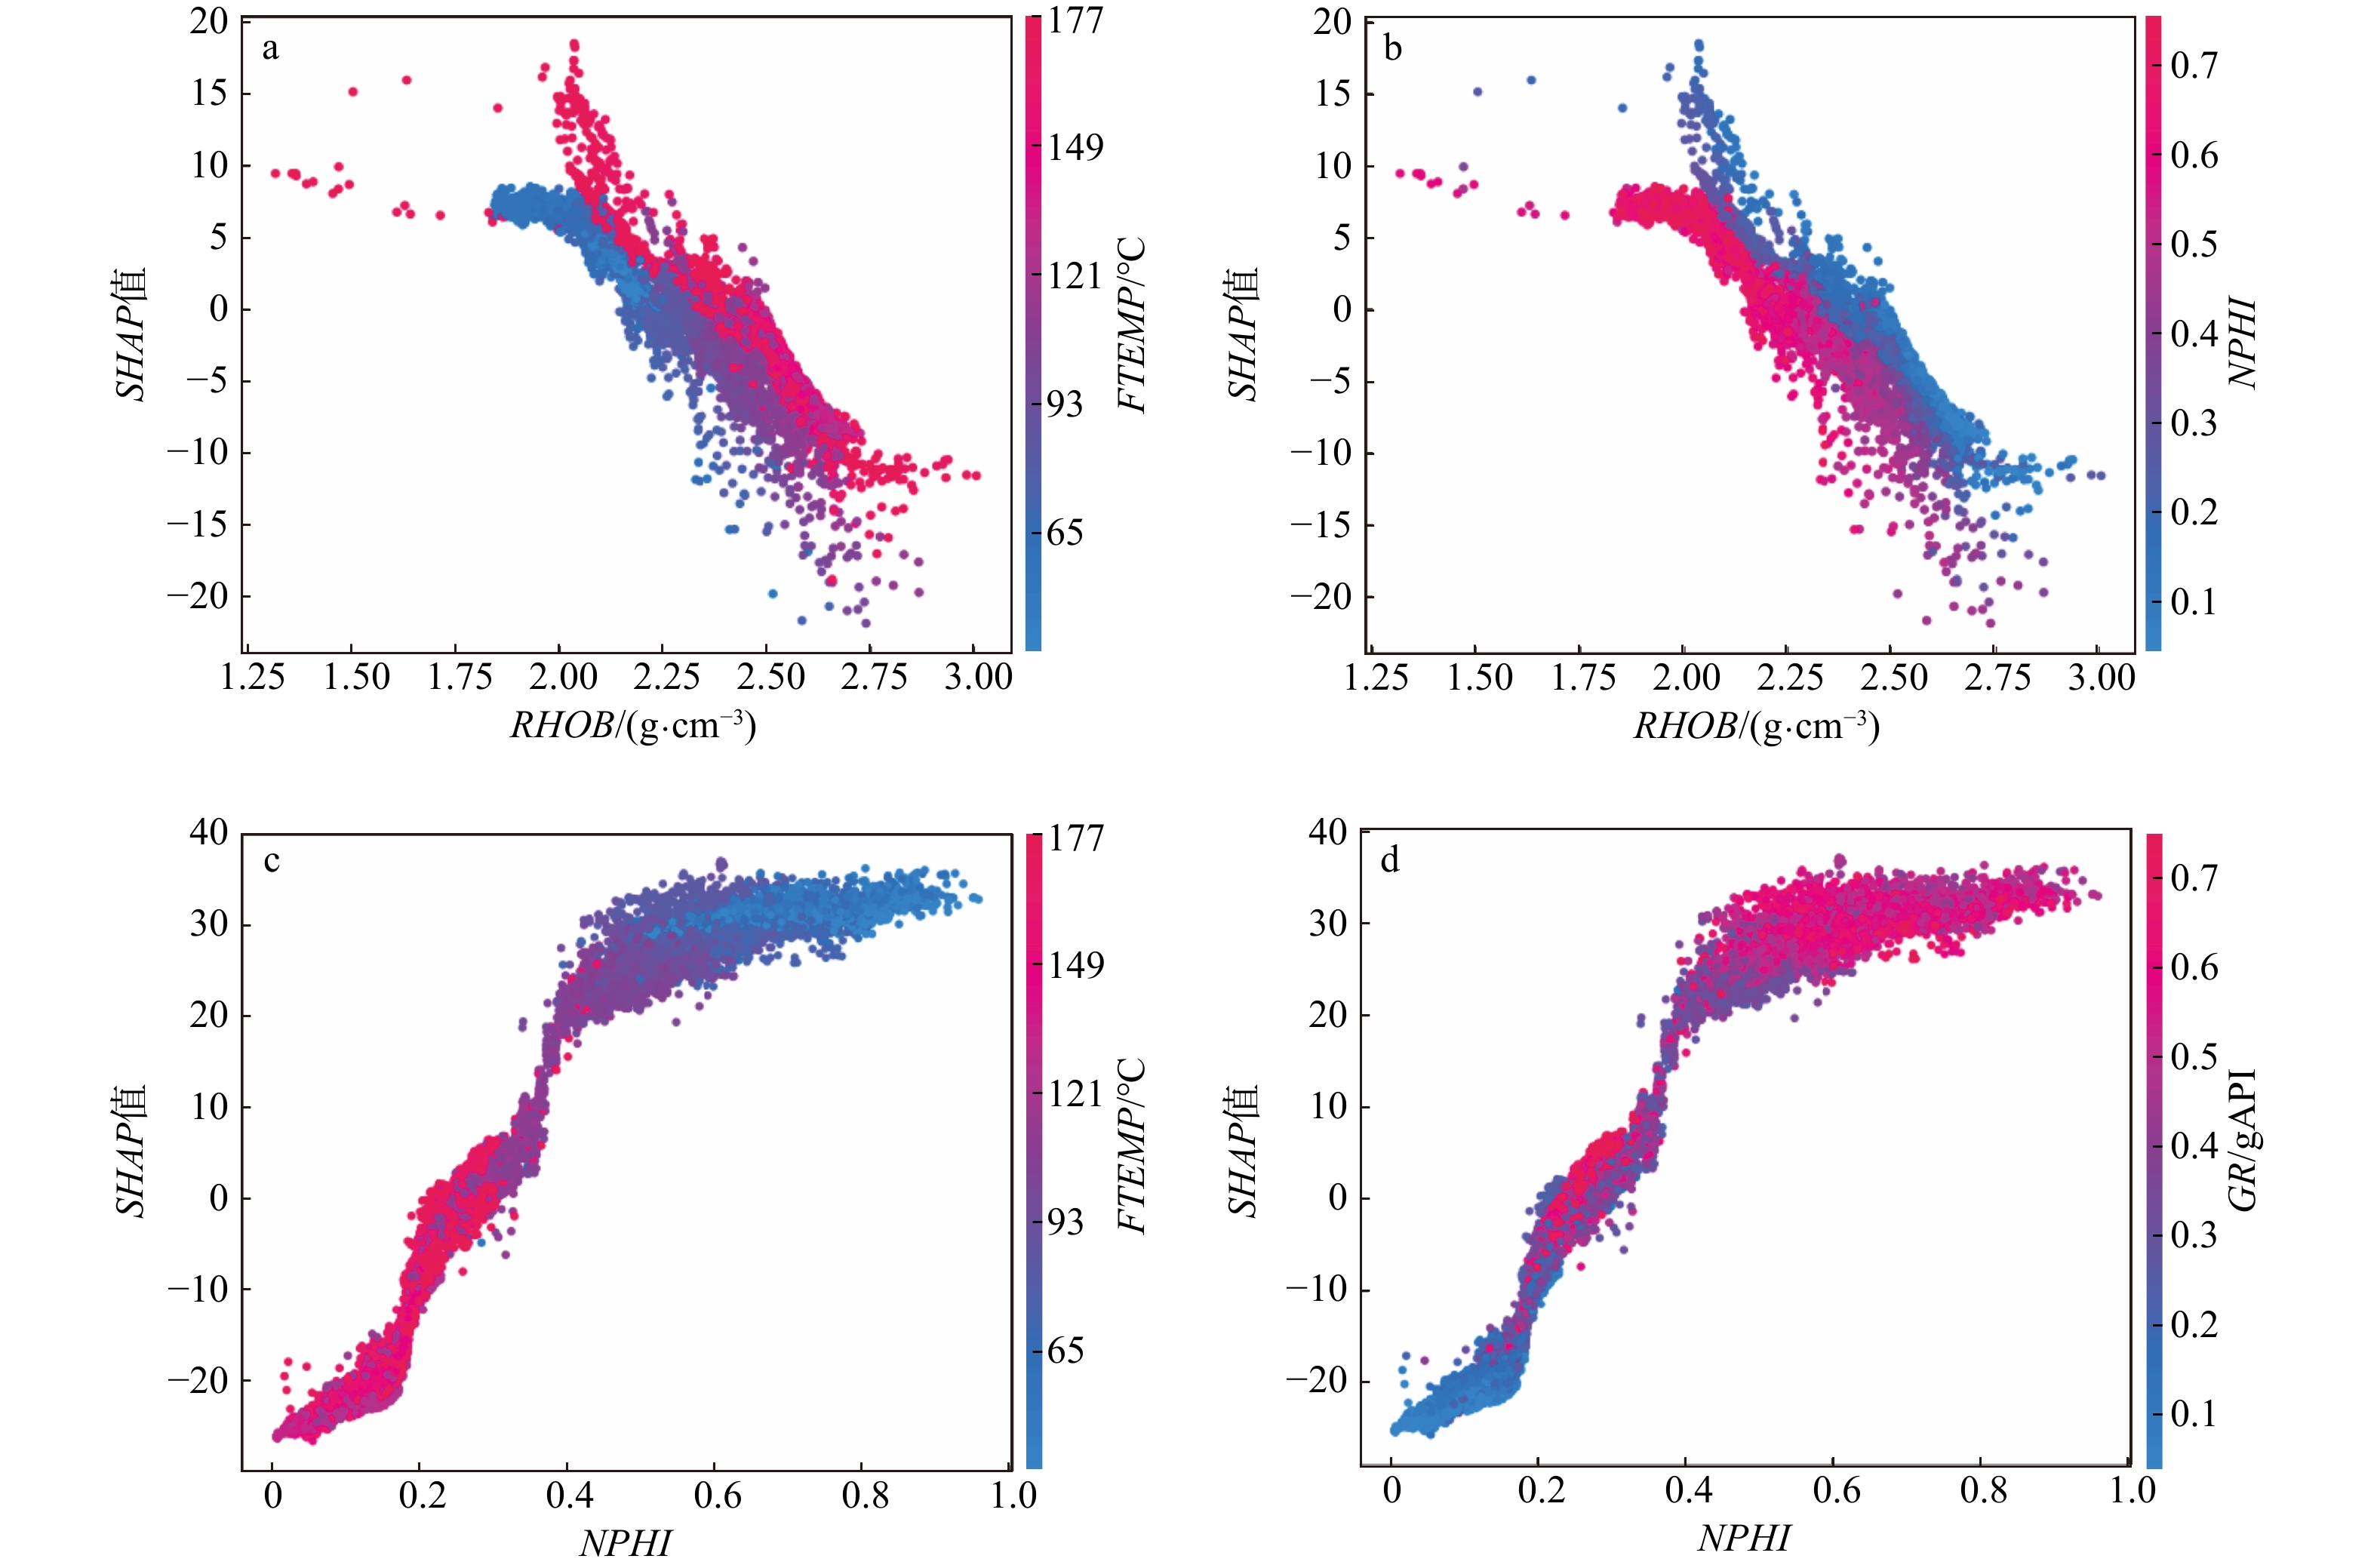
In this work, support vector regression (SVR), random forest (RF), and eXtreme gradient boosting (XGBoost) are compared with traditional multiple linear regression (LR) to reconstruct the acoustic logging curve of the NDR well 22-30b-11, and the XGBoost model is interpreted based on shapley additive explanations (SHAP) algorithm.
Results demonstrate that XGBoost outperforms SVR and RF on the test set, achieving
Results show that the machine learning algorithm is significantly better than the traditional multiple linear regression for logging curve reconstruction, indicating the feasibility of the SHAP algorithm in the interpretation of machine learning models for logging curve reconstruction, which provides a new idea for the subsequent development of machine learning in logging techniques.

| [1] |
周欣,曹俊兴,王兴建,等. 基于双向门控循环单元神经网络的声波测井曲线重构技术[J]. 地球物理学进展,2022,37(1):357-366. doi: 10.6038/pg2022EE0469
ZHOU X,CAO J X,WANG X J,et al. Acoustic log reconstruction based on bidirectional gated recurrent unit (GRU) neural network[J]. Progress in Geophysics,2022,37(1):357-366. (in Chinese with English abstract doi: 10.6038/pg2022EE0469
|
| [2] |
李红斌,王贵文,庞小娇,等. 苏北盆地古近系阜宁组页岩工程品质测井评价[J]. 地质科技通报,2023,42(3):311-322.
LI H B,WANG G W,PANG X J,et al. Logging evaluation of the engineering quality of the Paleogene Funing Formation oil shales in the Subei Basin[J]. Bulletin of Geological Science and Technology,2023,42(3):311-322. (in Chinese with English abstract
|
| [3] |
谭礼洪,张国强,谭忠健,等. 利用阵列声波测井资料评价变质岩储层有效性[J]. 石油地球物理勘探,2022,57(6):1464-1472.
TAN L H,ZHANG G Q,TAN Z J,et al. Evaluation of metamorphic reservoir effectiveness by array acoustic logging data[J]. Oil Geophysical Prospecting,2022,57(6):1464-1472. (in Chinese with English abstract
|
| [4] |
李焕然,唐晓明,李盛清,等. 压裂缝的动态渗透性能及其声波测井评价[J]. 石油勘探与开发,2022,49(1):194-202.
LI H R,TANG X M,LI S Q,et al. Dynamic fluid transport property of hydraulic fractures and its evaluation using acoustic logging[J]. Petroleum Exploration and Development,2022,49(1):194-202. (in Chinese with English abstract
|
| [5] |
李军,路菁,李争,等. 页岩气储层“四孔隙”模型建立及测井定量表征方法[J]. 石油与天然气地质,2014,35(2):266-271. doi: 10.11743/ogg20140214
LI J,LU J,LI Z,et al. ‘Four-pore’modeling and its quantitative logging description of shale gas reservoir[J]. Oil & Gas Geology,2014,35(2):266-271. (in Chinese with English abstract doi: 10.11743/ogg20140214
|
| [6] |
张海涛,杨小明,陈阵,等. 基于增强双向长短时记忆神经网络的测井数据重构[J]. 地球物理学进展. 2022,37(3):1214-1222.
ZHANG H T ,YANG X M ,CHEN Z,et al. Log data reconstruction method based on enhanced bidirectional long short-term memory neural network[J]. Progress in Geophysics,2022,37(3):1214-1222. (in Chinese with English abstract
|
| [7] |
丁阳阳,赵军龙,李兆明,等. 基于XGBoost算法的煤体结构测井识别技术研究[J]. 地球物理学进展,2022,37(3):998-1006. doi: 10.6038/pg2022FF0435
DING Y Y,ZHAO J L,LI Z M,et al. Research on logging recognition technology of coal structure based on XGBoost algorithm[J]. Progress in Geophysics,2022,37(3):998-1006. (in Chinese with English abstract doi: 10.6038/pg2022FF0435
|
| [8] |
李雄炎,秦瑞宝,刘小梅,等. 多方法对比分析及随钻声波测井曲线的预测[J]. 地球物理学进展,2016,31(3):1131-1138. doi: 10.6038/pg20160328
LI X Y,QIN R B,LIU X M,et al. Forecasting LWD acoustic logs based on comparison and analysis of multi-method[J]. Progress in Geophysics,2016,31(3):1131-1138. (in Chinese with English abstract doi: 10.6038/pg20160328
|
| [9] |
SMITH J H. A method for calculating pseudo sonics from e-logs in a clastic geologic setting[J]. Gulf Coast Association of Geological Societies Transactions,2007,57(1):675-678.
|
| [10] |
GARDNER G,GARDNER L W,GREGORY A R. Formation velocity and density:The diagnostic basics for stratigraphic traps[J]. Geophysics,1974,39(6):770-780. doi: 10.1190/1.1440465
|
| [11] |
CASTAGNA,J P,BATZLE M L,EASTWOOD R L. Relationships between compressional-wave and shear-wave velocities in clastic silicate rocks[J]. Geophysics,1985,50(4):571-581. doi: 10.1190/1.1441933
|
| [12] |
杨怀杰,乔宝强. 基于多元回归模型的拟声波时差测井曲线重构方法研究[J]. 铀矿地质,2021,37(3):500-505.
YANG H J,QIAO B Q. Study on reconstruction method of quasi-acoustic time difference log based on multiple regression nodel[J]. Uranium Geology,2021,37(3):500-505. (in Chinese with English abstract
|
| [13] |
ZHANG D,TSAI J. Machine learning and software engineering[J]. Softw. Qual. J.,2003,11:87-119. doi: 10.1023/A:1023760326768
|
| [14] |
张家臣,邓金根,谭强,等. 基于XGBoost的测井曲线重构方法[J]. 石油地球物理勘探,2022,57(3):697-705.
ZHANG J C,DENG J G,TAN Q,et al. Reconstruction of well logs based on XGBoost[J]. Oil Geophysical Prospecting,2022,57(3):697-705. (in Chinese with English abstract
|
| [15] |
CRANGANU C,BAUTU E. Using gene expression programming to estimate sonic distributions on the natural gamma-ray and deep resistivity logs:A case study from the Anadarko Basin,Oklahoma[J]. J. Pet. Sci. Eng.,2010,70:243-255. doi: 10.1016/j.petrol.2009.11.017
|
| [16] |
FENG R,GRANA D,BALLING N. Imputation of missing well log data by random forest and its uncertainty analysis[J]. Computers & Geosciences,2021,152:104763.
|
| [17] |
ZHAO X B,CHEN X J,HUANG Q,et al. Logging-data driven permeability prediction in low-permeable sandstones based on machine learning with pattern visualization:A case study in Wenchang A Sag,Pearl River Mouth Basin[J]. J. Petrol. Sci. Eng. ,2022,214:110517.
|
| [18] |
黄发明,胡松雁,闫学涯,等. 基于机器学习的滑坡易发性预测建模及其主控因子识别[J]. 地质科技通报,2022,41(2):79-90.
HUANG F M,HU S Y,YAN X Y,et al. Landslide susceptibility prediction and identification of its main environmental factors based on machine learning models[J]. Bulletin of Geological Science and Technology,2022,41(2):79-90. (in Chinese with English abstract
|
| [19] |
张驰,潘懋,胡水清,等. 融合储层纵向信息的机器学习岩性识别方法[J]. 地质科技通报,2023,42(3):289-299.
ZHANG C,PAN M,HU S Q,et al. A machine learning lithologic identification method combined with vertical reservoir information[J]. Bulletin of Geological Science and Technology,2023,42(3):289-299. (in Chinese with English abstract
|
| [20] |
BREIMAN L. Random forests[J]. Machine Learning,2001,45:5-32. doi: 10.1023/A:1010933404324
|
| [21] |
LI Y,ZOU C,BERECIBAR M,et al. Random forest regression for online capacity estimation of lithiumion batteries[J]. Applied Energy,2018,232:197-210. doi: 10.1016/j.apenergy.2018.09.182
|
| [22] |
杨灿,刘磊磊,张遗立,等. 基于贝叶斯优化机器学习超参数的滑坡易发性评价[J]. 地质科技通报,2022,41(2):228-238.
YANG C,LIU L L,ZHANG Y L,et al. Machine learning based on landslide susceptibility assessment with Bayesian optimized the hyperparameters[J]. Bulletin of Geological Science and Technology,2022,41(2):228-238. (in Chinese with English abstract
|
| [23] |
LUO S,XU T,WEI S J. Prediction method and application of shale reservoirs core gas content based on machine learning[J]. J. Appl. Geophys.,2022,204:104741. doi: 10.1016/j.jappgeo.2022.104741
|
| [24] |
PAN S,ZHENG Z,GUO Z,et al. An optimized XGBoost method for predicting reservoir porosity using petrophysical logs[J]. Journal of Petroleum Science and Engineering,2022,208:109520. doi: 10.1016/j.petrol.2021.109520
|
| [25] |
CHEN T,GUESTRIN C. XGBoost:A scalable tree Boosting system[C]//Anon. Proceedings of the 22nd ACM SIGKDD International Conference on Knowledge Discovery and Data Mining,KDD ’16. Association for Computing Machinery. New York:[S. n. ],2016:85-794.
|
| [26] |
MANGALATHU S,HWANG S H,JEON J S. Failure mode and effects analysis of RC members based on machine-learning-based SHapley Additive exPlanations (SHAP) approach[J]. Engineering Structures,2020,219:110927. doi: 10.1016/j.engstruct.2020.110927
|
| [27] |
LUNDBERG S M,LEE S I. A unified approach to interpreting model predictions[C]//Anon. Proceedings of the 31st International Conference on Neural Information Processing Systems. Red Hook:[S. n. ] ,2017:4768-4777.
|
| [28] |
FENG D C,WANG W J,MANGALATHU S,et al. Interpretable XGBoost-SHAP machine-learning model for shear strength prediction of squat RC walls[C]. J. Struct. Eng. ,2021,147:04021173.
|
| [29] |
EKANAYAKE I U,MEDDAGE D P P,RATHNAYAKE U. A novel approach to explain the black-box nature of machine learning in compressive strength predictions of concrete using Shapley additive explanations (SHAP)[J]. Case studies in construction materials,2022,16:e01059.
|
| [30] |
JAS K,DODAGOUDAR G. Explainable machine learning model for liquefaction potential assessment of soils using XGBoost-SHAP[J]. Soil Dyn. Earthq. Eng.,2023,165:107662. doi: 10.1016/j.soildyn.2022.107662
|
Copyright © 2010Editorial Department of Bulletin of Geological Science and Technology

Supported by:
Beijing Renhe Information Technology Co., Ltd.


 DownLoad: